A break of structure (BOS) happens when price closes beyond the most recent swing high in an uptrend, or below the most recent swing low in a downtrend. It tells you that the trend is still making progress, which is why many price action traders use it as a sign of continuation. This guide explains what a BOS is, how to tell a real one from a wick that only pokes through a level, and how to turn it into a trade plan with an entry, a stop and a target. If you are new to the idea of swings, start with what market structure is first.
What a break of structure means
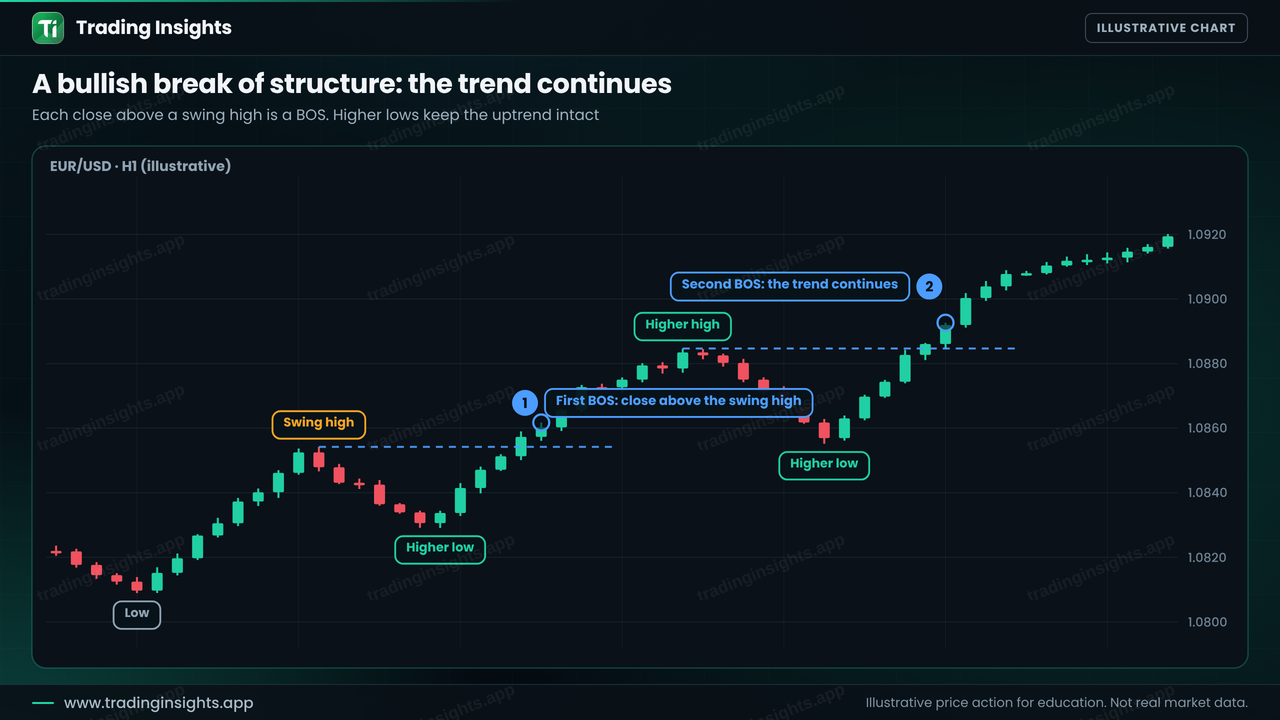
Price moves in a series of swings. In an uptrend, each push up makes a higher high and each pullback makes a higher low. A BOS is the moment price takes out the previous swing high with a candle close. The trend has set a new high and, as long as the higher lows stay intact, the structure remains bullish.
The same idea works in reverse. In a downtrend, price makes lower highs and lower lows, and a BOS happens when a candle closes below the previous swing low. A BOS does not predict how far price will go. It only says that the existing trend has not broken down yet. For the full picture of both directions, see bullish vs bearish market structure.
A bullish BOS step by step
Look at the chart below. Price rises, pulls back, then closes above the earlier swing high. That is the first BOS. The pullback after it holds above the previous low, so the structure stays bullish, and a later close above the next swing high is a second BOS.
- Mark the swing high. Find the most recent clear peak that has lower candles on both sides.
- Wait for a close above it. The break counts when a candle body closes beyond the level.
- Check the last swing low. A higher low confirms the trend is still healthy.
Wick or close: what counts as a break?
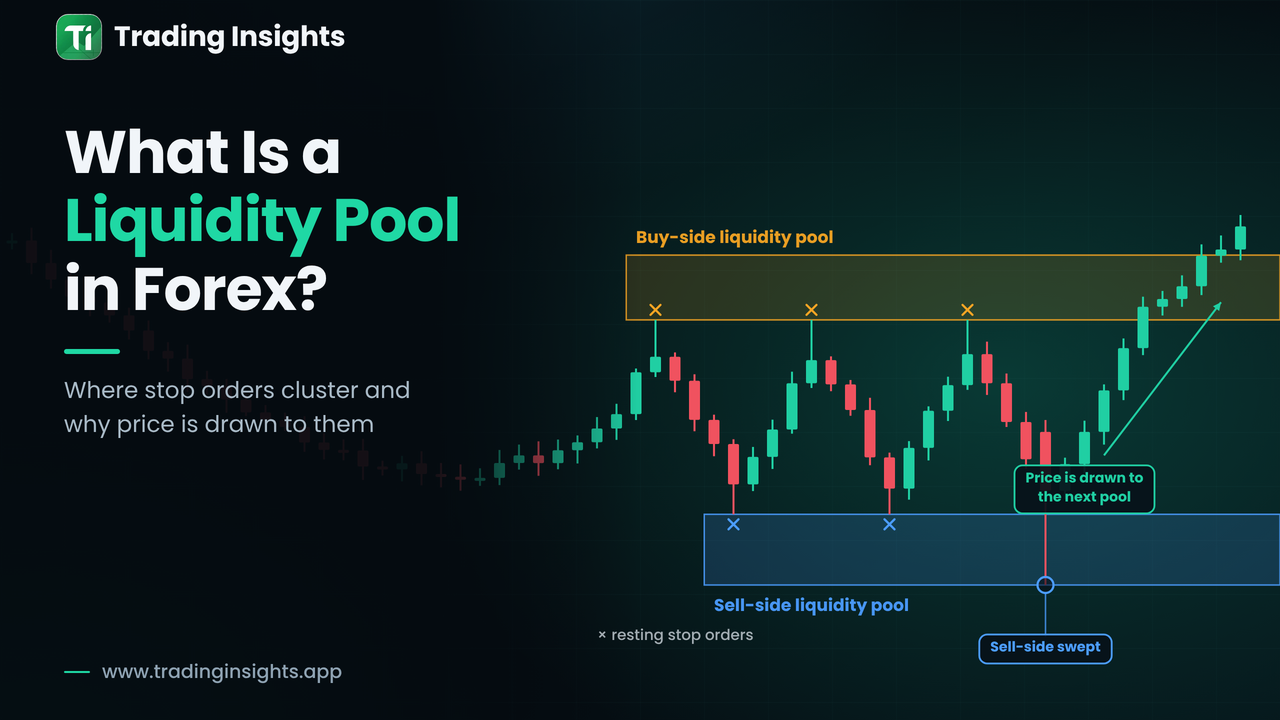
This is the most common source of confusion. Price often spikes above a swing high with a long wick and then closes back below it. That is not a BOS. Many of these spikes are liquidity grabs, where stops sitting above the high are triggered and price turns around. Most traders wait for a candle close beyond the level, because a close shows that price was accepted there.
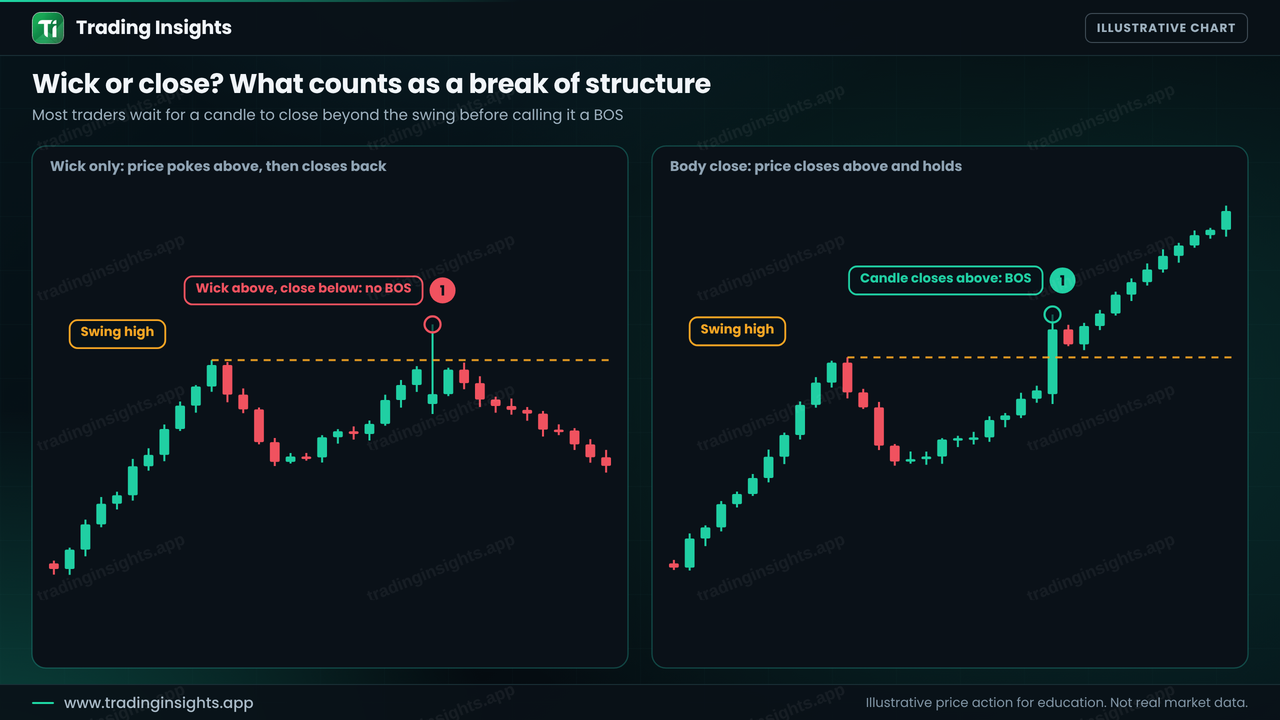
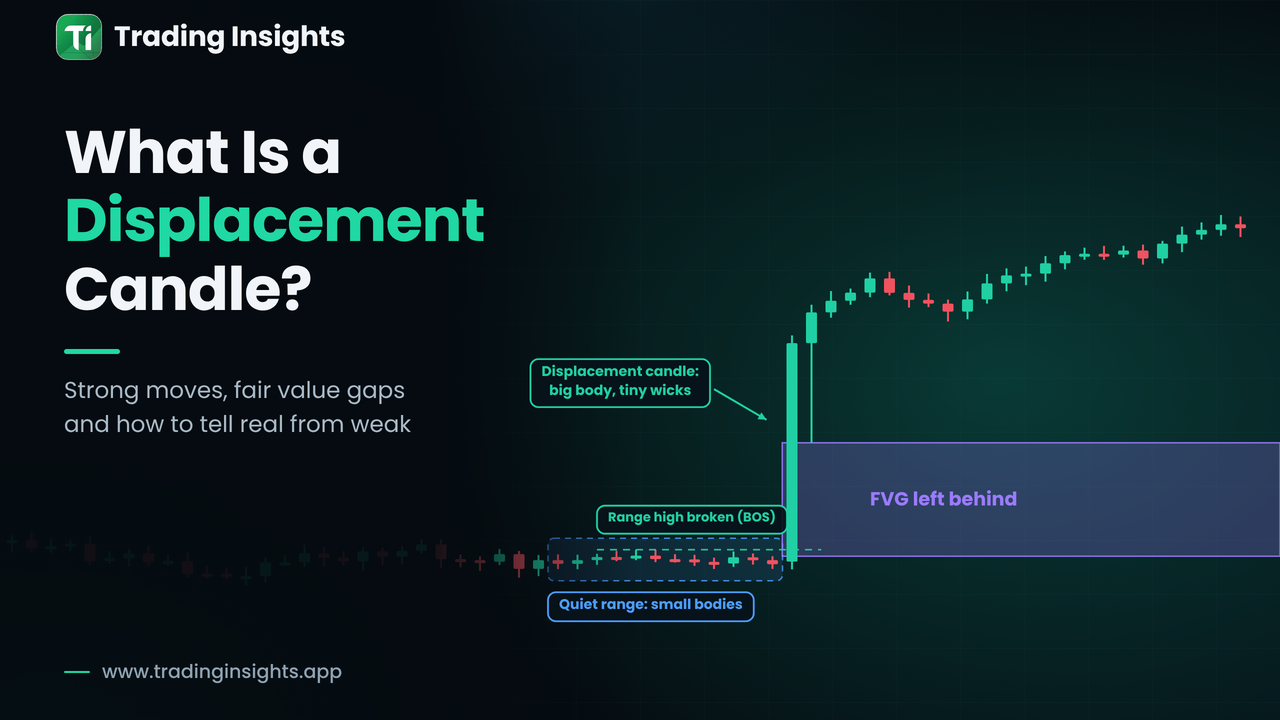
You can strengthen the case by looking at the break itself. A strong, one-sided candle with a small wick is more convincing than a slow candle that barely closes above the level. This is the idea behind displacement candles. To learn how wick-only breaks happen, see inducement vs liquidity sweep and equal highs and equal lows.
How to trade a BOS: wait for the retest
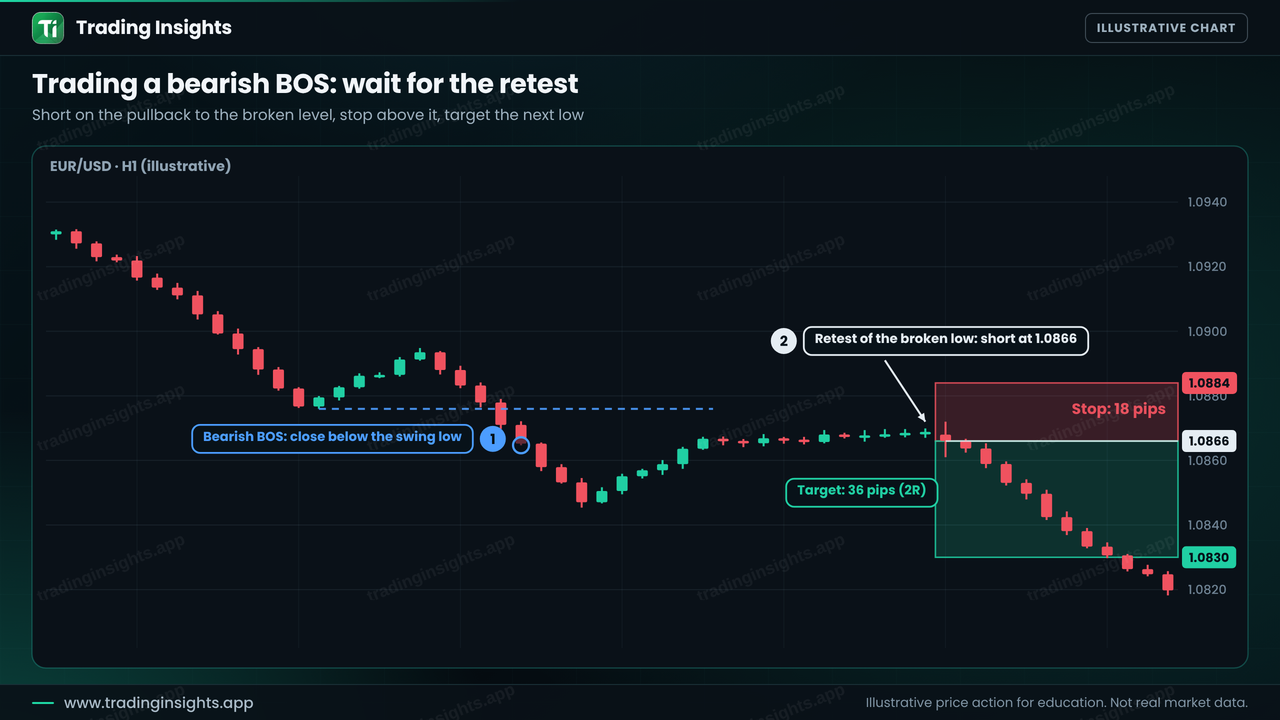
Buying or selling the moment price breaks is risky, because you do not know whether price will hold beyond the level. A calmer approach is to wait for a pullback to the broken level, often called a retest. If the old swing acts as new support (or resistance), you have a clear place to enter and a clear place to be wrong.
Here is a bearish example on EUR/USD, H1. Price makes a lower high, then closes below the previous swing low. That is the BOS. Price rallies back to the broken low, stalls, and the plan is to sell the retest.