A displacement candle is a large, decisive candle (or a short run of candles) that moves price sharply in one direction, usually with a big body, small wicks and a close near its extreme. It shows that one side overwhelmed the other, and traders pay attention to it because it often breaks structure and leaves behind a fair value gap.
What makes a candle a displacement
Size alone is not enough. A displacement candle usually shows several traits together:
A large body compared with the recent average candle.
Small wicks. Little opposing pressure shows up in the shadows.
A close near the high or low. The candle finishes close to where it travelled.
Speed. The move covers distance in very few candles.
A consequence. It breaks a swing and, frequently, leaves a gap between neighbouring candles.
A run of two or three strong candles in the same direction can serve as displacement too, provided together they show the same one-sided character.
A worked example
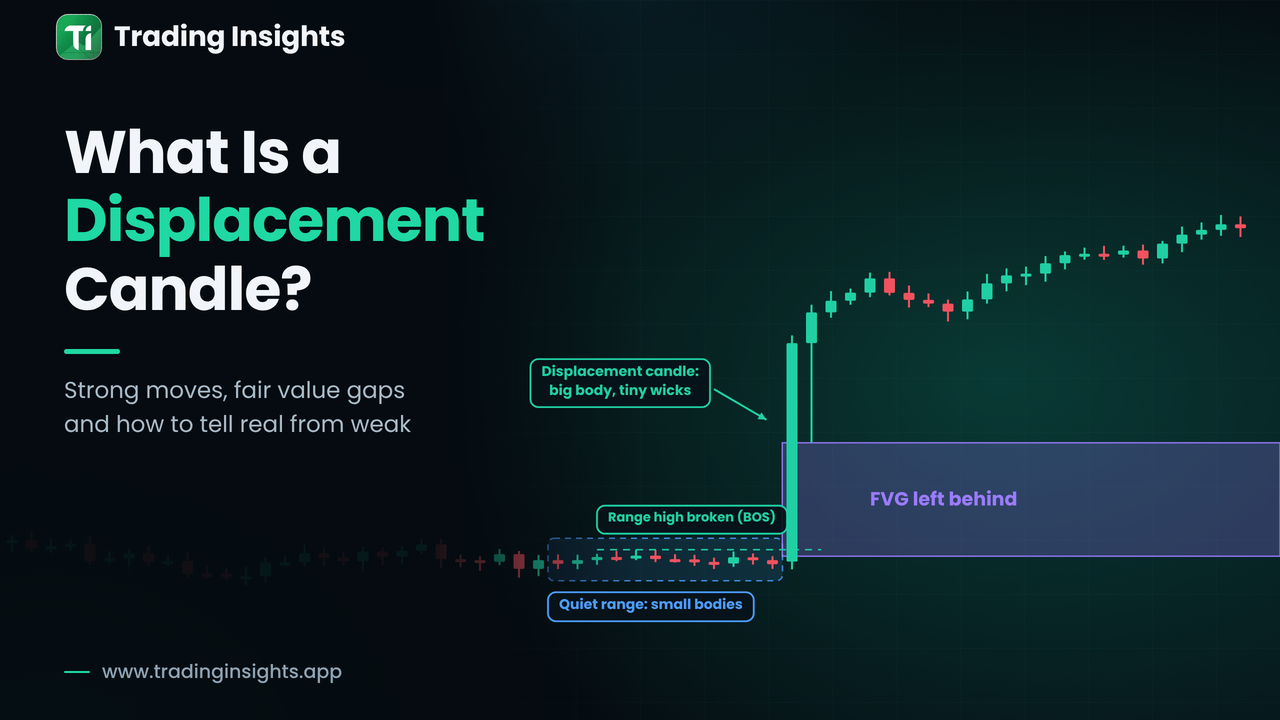
In the chart below, price spends several candles in a quiet range. One large candle then closes above the range high, leaving a purple gap between the first and third candle of the move. The label shows the body at roughly seventeen times the recent average in this illustration. The break above the range high is a BOS, and the gap left behind is a fair value gap.
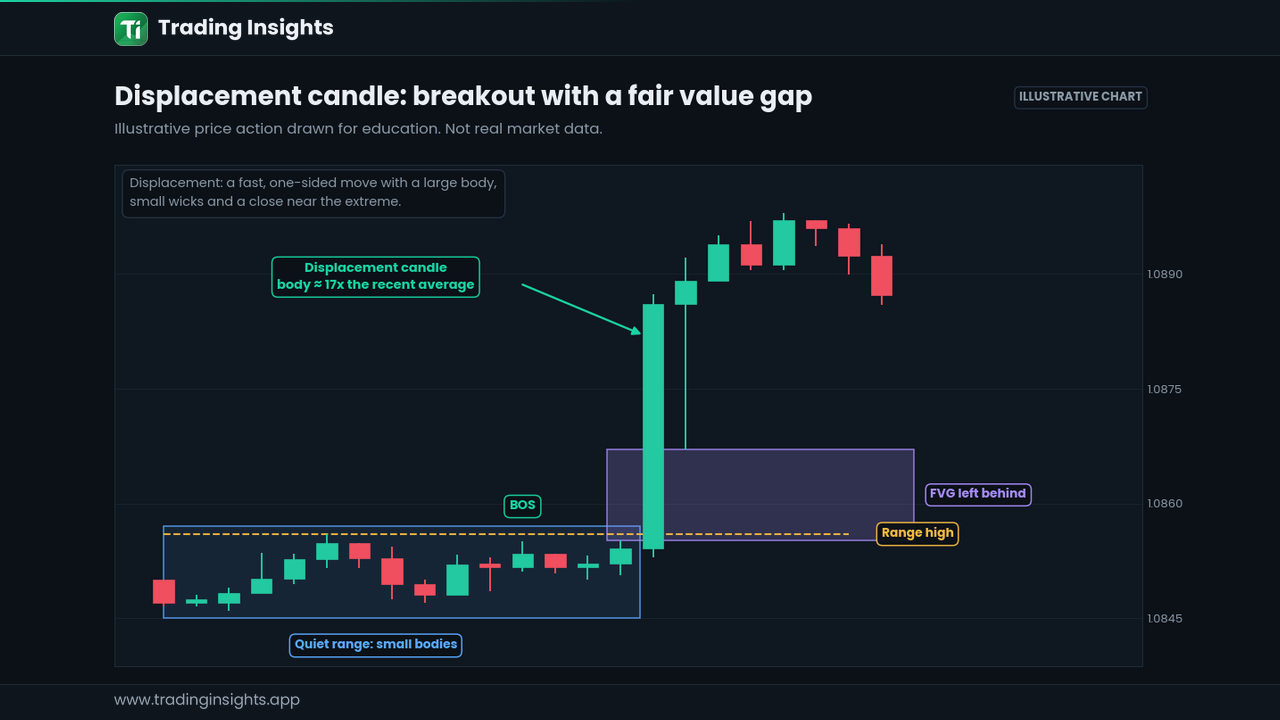
Figure 1: A displacement candle breaks the range high and leaves a fair value gap behind.
How to measure displacement
"Large" is relative, so give it a number. Two simple methods are popular:
Compare with recent bodies. Take the average candle body of the last 10 to 20 candles. A body that is several times larger is a candidate.
Compare with ATR. If the candle's range is clearly larger than the ATR of recent candles, it stands out from normal activity.
There is no universal threshold. Pick a rule, apply it consistently and review whether it separates meaningful moves from noise on your own instrument and timeframe.
Why displacement matters
It confirms intent. A strong move that breaks a swing is a better sign of a real structure break than a slow drift. See the BOS and CHoCH explanation in what market structure is.
It leaves footprints. A fair value gap, an order block or a new swing high can all form during displacement. The rules for judging the gap are in how to identify a valid fair value gap, and the zone at its start is the idea behind an order block.
It helps filter breaks. A breakout with displacement is usually treated with more respect than one without.
Displacement vs a weak break
Not every close beyond a level is displacement. Look at the next chart. Price also breaks the range high, but it does so slowly, with overlapping candles and long wicks. There is no gap, and price falls straight back. Many traders would regard this as a low-conviction break.
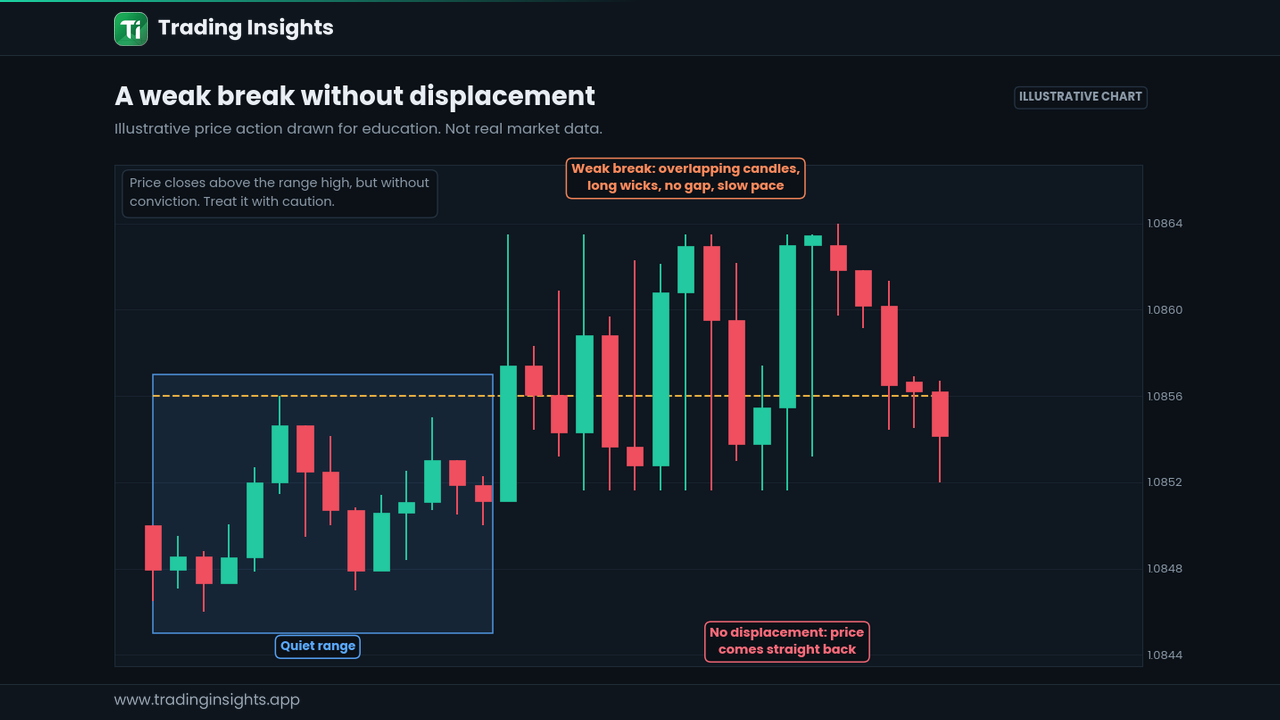
Figure 2: A weak break. Overlapping candles and long wicks show little conviction.
Feature | Displacement | Weak break |
|---|---|---|
Candle bodies | Large compared with recent candles | Small or mixed |
Wicks | Short | Long on both sides |
Candle overlap | Little overlap between candles | Heavy overlap |
Gap left behind | Often, as a fair value gap | Rarely |
Follow-through | Price tends to hold beyond the level | Price often returns inside the range |
Displacement vs a news spike
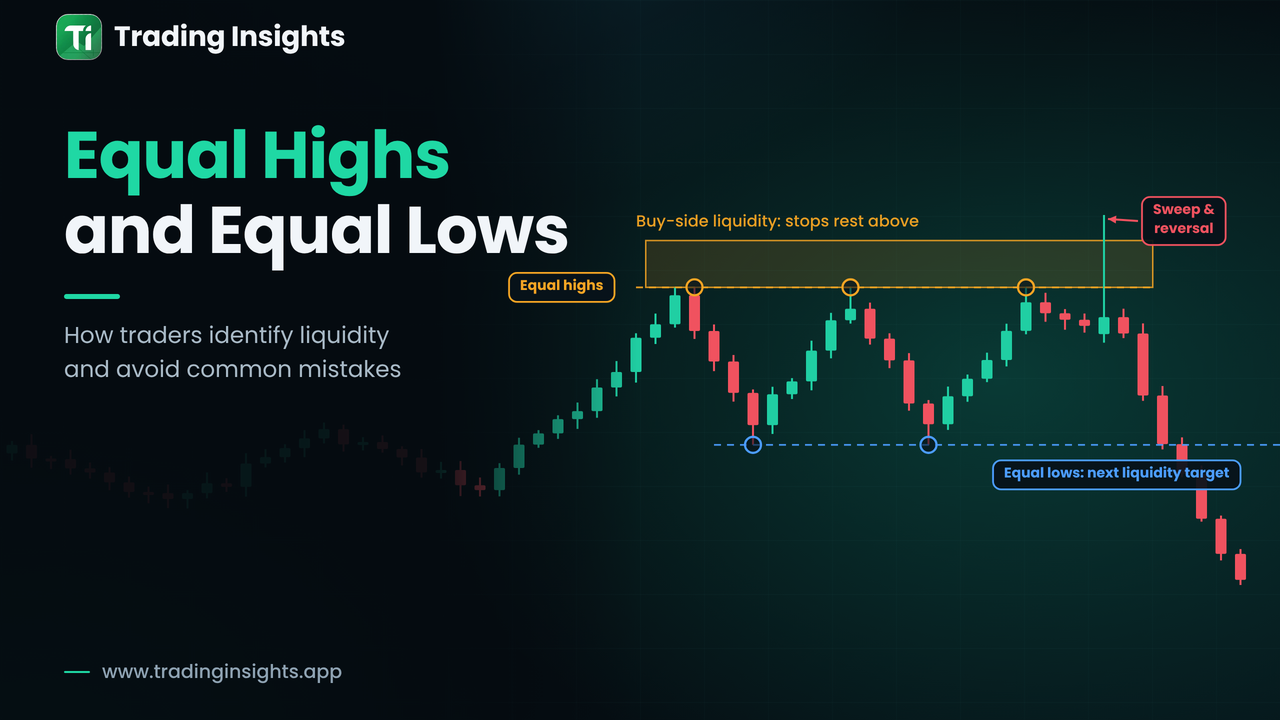
A news release can also produce a huge candle. The difference is in what follows. A spike with a very long wick that fully reverses is closer to a liquidity grab than to genuine displacement, while a candle that closes strongly and holds is more consistent with real order flow. Check whether price keeps the move over the next few candles.
How to use displacement in your analysis
Identify the swing or range that price is trying to break.
Wait for a candle close beyond it, not just a wick.
Measure the body against recent candles or ATR.
Check for a gap or a base candle at the origin of the move.
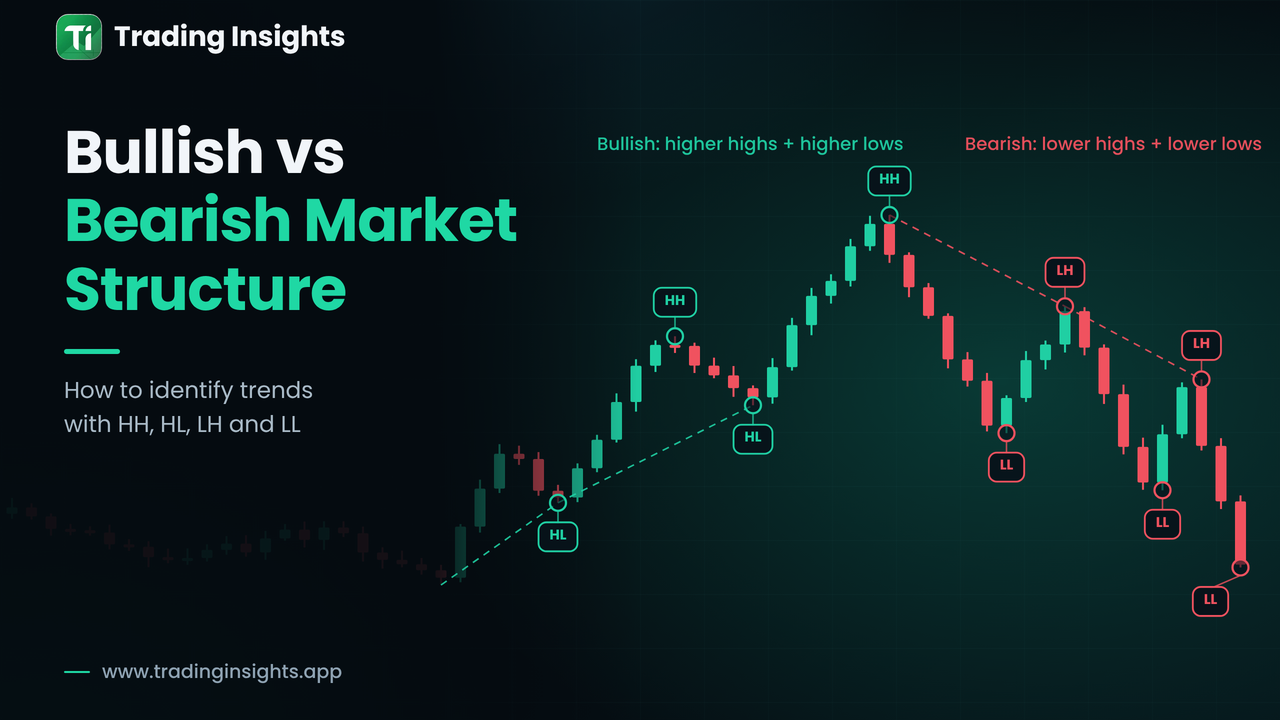
Note which direction the larger trend is going. A displacement that agrees with the higher timeframe carries more weight, as discussed in bullish vs bearish market structure.
Decide in advance what would invalidate the idea.
Common mistakes
Calling any big candle a displacement without checking whether it broke structure.
Ignoring wicks. A large body with a huge opposing wick is a mixed signal.
Chasing the candle after it has closed instead of waiting for a plan.
Using the same size threshold for every market and timeframe.
Frequently asked questions
Is a displacement candle the same as a momentum candle?
The terms overlap. "Displacement" is typically used when the candle also breaks structure and leaves a gap or footprint, while "momentum candle" is a looser phrase.
Does every displacement leave a fair value gap?
No. A gap forms only if the wicks of the neighbouring candles do not overlap. Strong moves often leave one, but it is not required.
Can displacement fail?
Yes. Price can retrace the entire move. That is why traders define invalidation before acting rather than relying on the candle alone.
This article is for education only and is not financial advice. Trading carries risk, and no candle pattern guarantees an outcome.