A liquidity pool is an area on the chart where many orders are waiting to be filled, most often stop-loss orders and pending breakout orders placed just beyond an obvious high or low. Traders study these areas because large participants need other orders to trade against, and clusters of resting orders are exactly where that volume is available.
Liquidity in plain language
In trading, liquidity means there are enough orders in the market to buy or sell without moving the price too much. A market needs a buyer for every seller. When a big order has to be filled, it is easier to do so where lots of opposing orders are already sitting. That is why traders watch for places where those orders gather: the pools.
Where the orders come from
Think about what traders do around an obvious swing high. Someone who is short usually places a stop-loss above it, and a stop-loss on a short position is a buy order. Someone who wants to catch a breakout places a buy stop above it. Both groups leave buy orders in the same place. The same logic works below a swing low, where long traders place stop-losses (sell orders) and breakout sellers place sell stops.
Buy-side liquidity (BSL): buy orders resting above highs.
Sell-side liquidity (SSL): sell orders resting below lows.
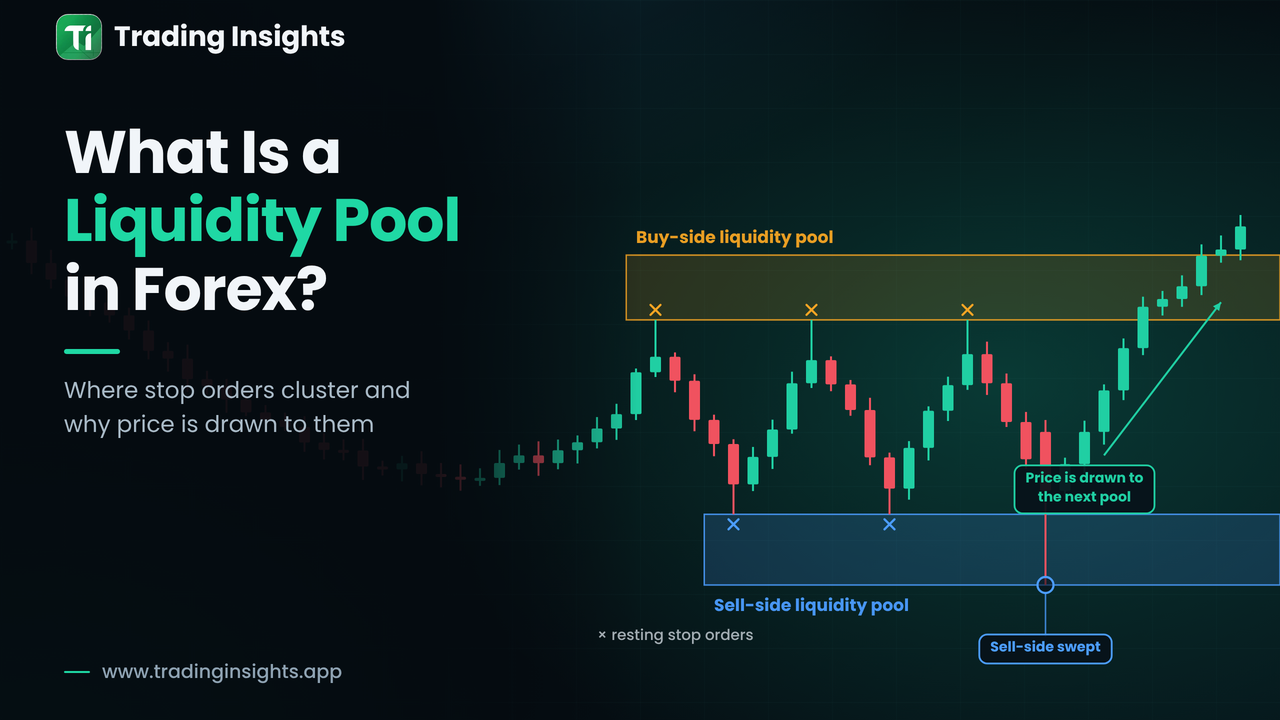
The chart below marks both on a simple range. The amber zone above the repeated highs is buy-side liquidity, and the blue zone under the repeated lows is sell-side liquidity.
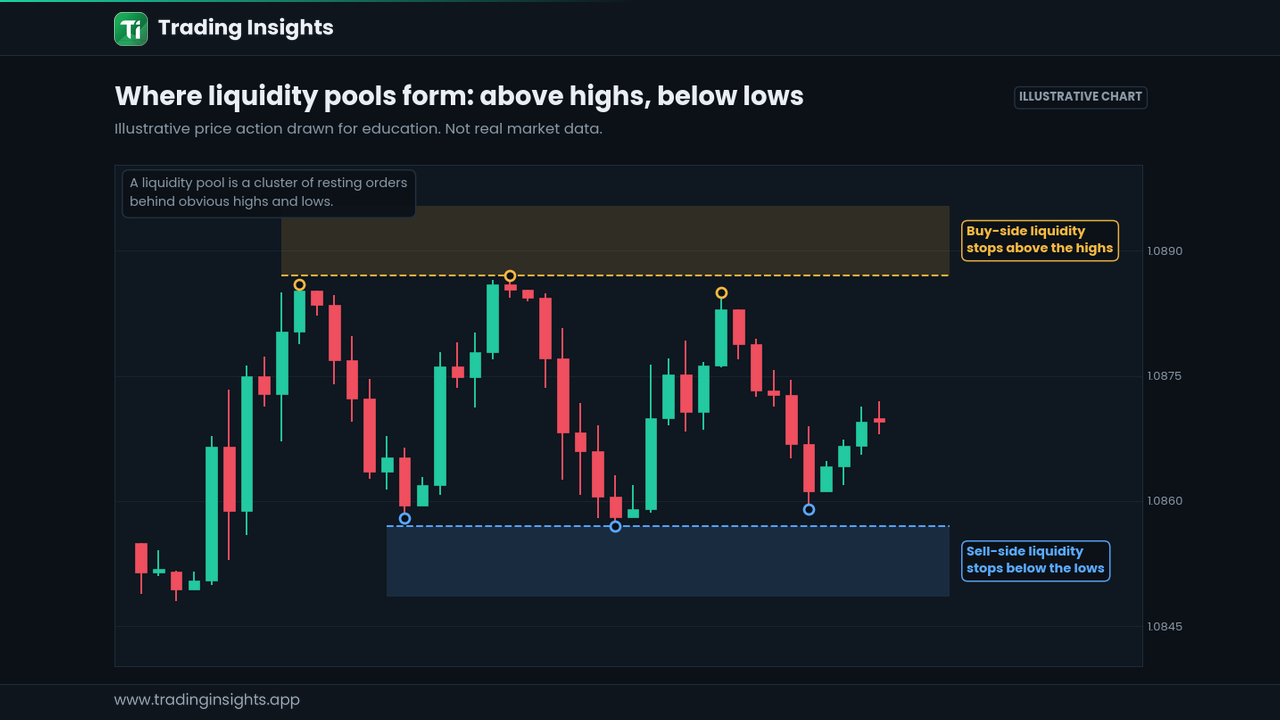
Figure 1: Buy-side liquidity sits above repeated highs and sell-side liquidity below repeated lows.
Common places liquidity pools form
Equal highs and equal lows, where several swings stop at nearly the same price.
Obvious swing highs and swing lows on the active timeframe.
The high and low of the previous day, week or month.
The boundaries of a clean range, including Asian-session highs and lows.
Trendline touches, where traders tend to place stops just behind the line.
Round numbers such as 1.1000, which attract pending orders.
The more obvious the level, the more orders tend to gather behind it. A level that was tested several times and respected on a higher timeframe usually holds more resting orders than a random minor wiggle.
What a liquidity sweep looks like
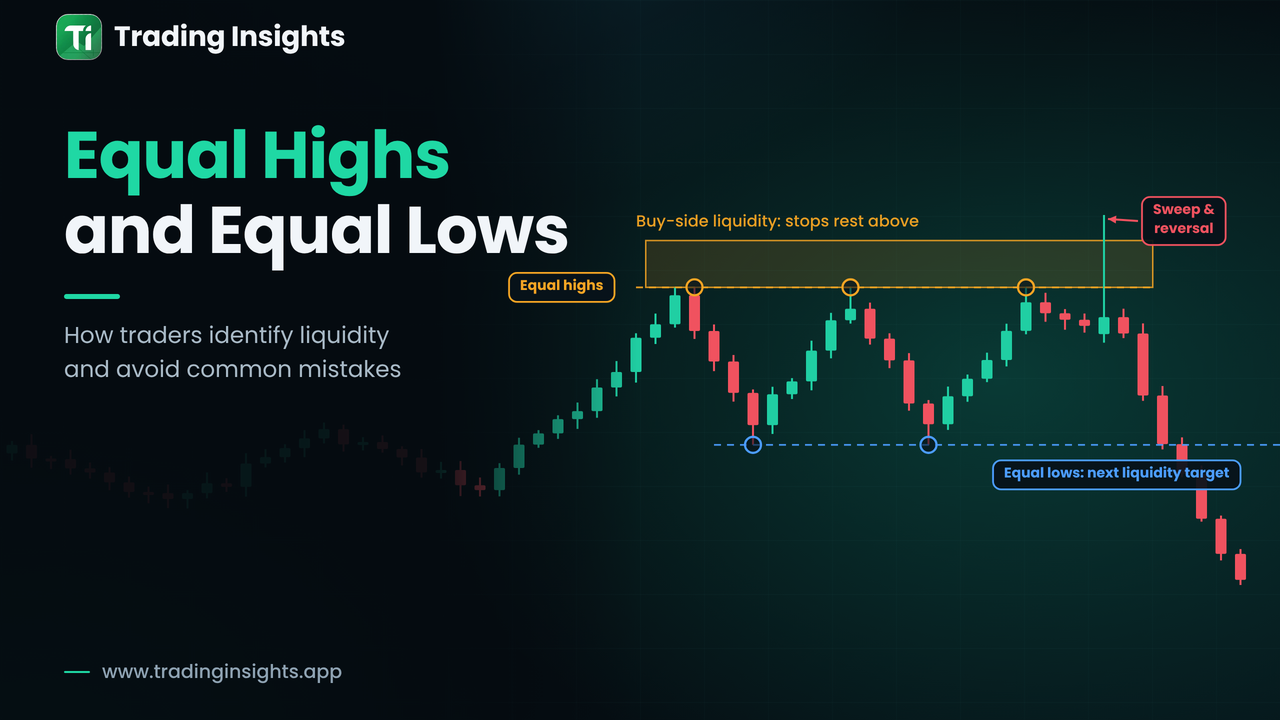
A liquidity sweep (sometimes called a stop run) is when price trades through a pool, triggers the orders resting there, and then fails to continue. On the chart it often appears as a long wick beyond the level followed by a close back inside the old range. The orders were taken, and with no further fuel for the move, price can reverse or at least stall.
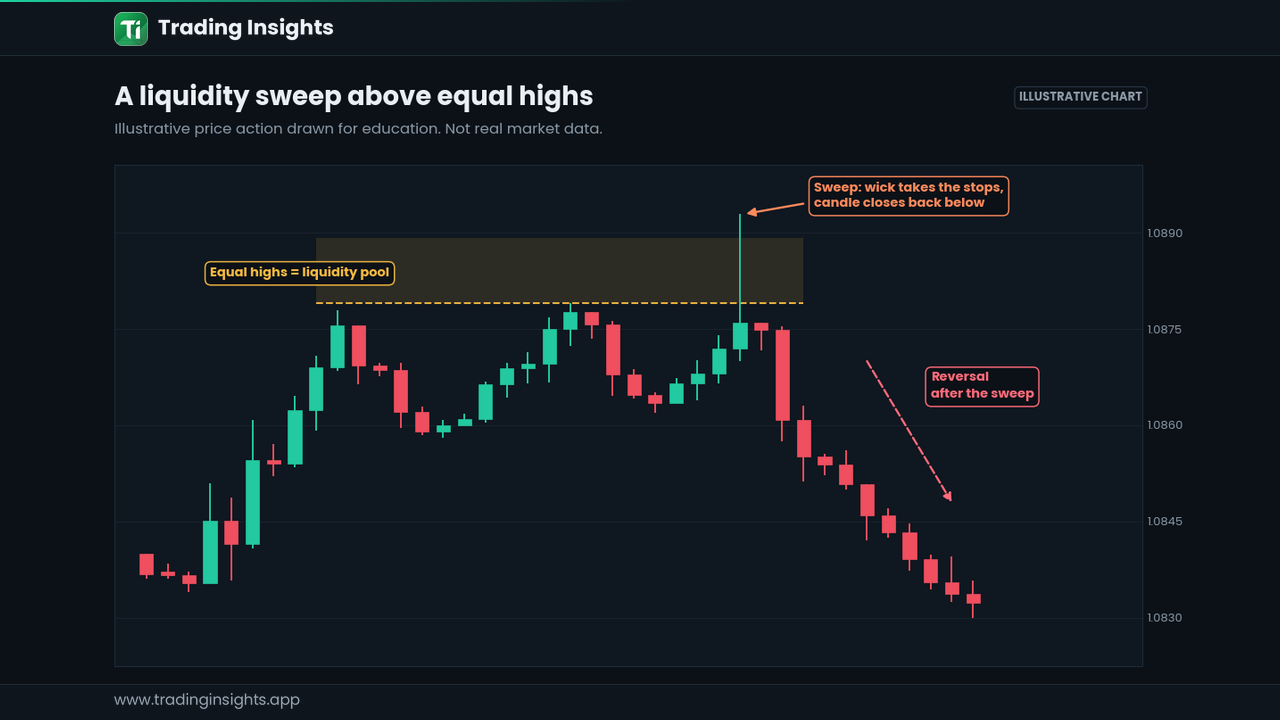
Figure 2: A wick takes the stops above equal highs, the candle closes back below, and price moves lower.
This does not mean every sweep leads to a reversal. Sometimes price breaks a level and keeps going, and the stops simply fuelled a real breakout. What matters is how price behaves after the level is taken, which is why structure confirmation matters. If you are new to that side, start with what market structure is.
Liquidity pool vs support and resistance
Idea | Support and resistance | Liquidity pool |
|---|---|---|
Main question | Will price bounce here? | Which orders are resting here, and what happens if they are taken? |
Where it sits | At the level itself | Just beyond the level |
Typical reading | A break means the level failed | A quick break and return can mean the level did its job |
How to use the concept in practice
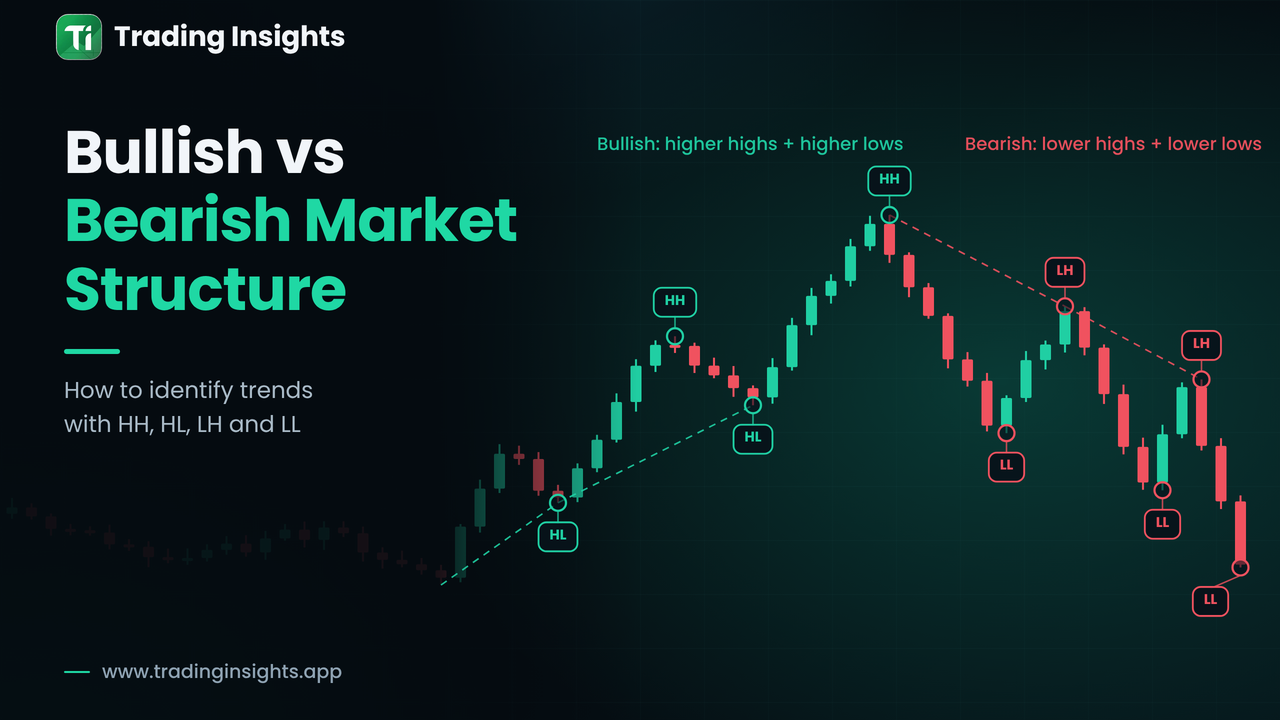
Mark the obvious highs and lows on a higher timeframe.
Note which ones have equal levels or several touches. These are the most visible pools.
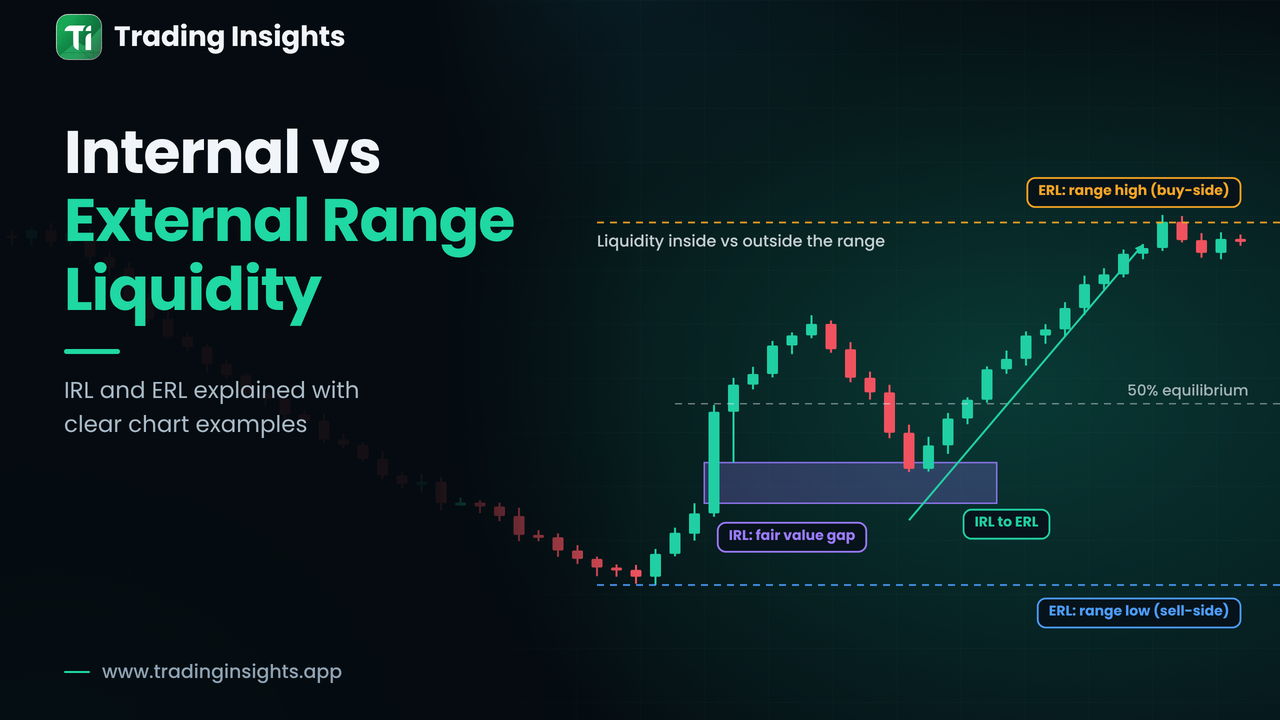
Decide which pool price is more likely to be drawn toward given the current direction. Our guide to internal vs external range liquidity explains one way to frame this.
Wait for price to reach the pool and watch the reaction: a close back inside the range, or a sharp displacement away.
Define where your idea is wrong before acting, and size the risk accordingly.
Where to place your own stop
If many traders put stops at the same obvious spot, yours can be swept along with theirs. One response is to give your stop room beyond the pool, for example a buffer equal to part of the ATR, and to reduce position size so the wider stop keeps your risk the same. Another is to wait for the sweep to happen and for price to close back inside before committing, which usually allows a tighter and more logical invalidation point. Neither approach removes risk; both aim to avoid putting your stop exactly where the crowd puts theirs.
Common mistakes
Assuming price must reach every pool. Pools are context, not targets.
Calling every wick through a high a sweep. Look for a close back inside and a follow-through move.
Ignoring the trend. A sweep against a strong higher-timeframe trend is often just a pullback trap for the other side.
Placing your own stop exactly at the obvious level, where it joins the crowd.
Frequently asked questions
Is a liquidity pool the same as a stop hunt?
A pool is the cluster of orders; a stop hunt (or sweep) is price trading into it. The pool exists before the move happens.
Does price always reverse after taking liquidity?
No. Sometimes the break is genuine and continues. Confirmation from closes and structure after the sweep is what separates the two cases.
Can retail traders really see liquidity?
Not directly. You cannot see other people's orders, so liquidity pools are inferred from where traders typically place stops. Treat them as a reasoned assumption, not a fact.
This article is for education only and is not financial advice. Trading involves risk, and any chart concept can fail.