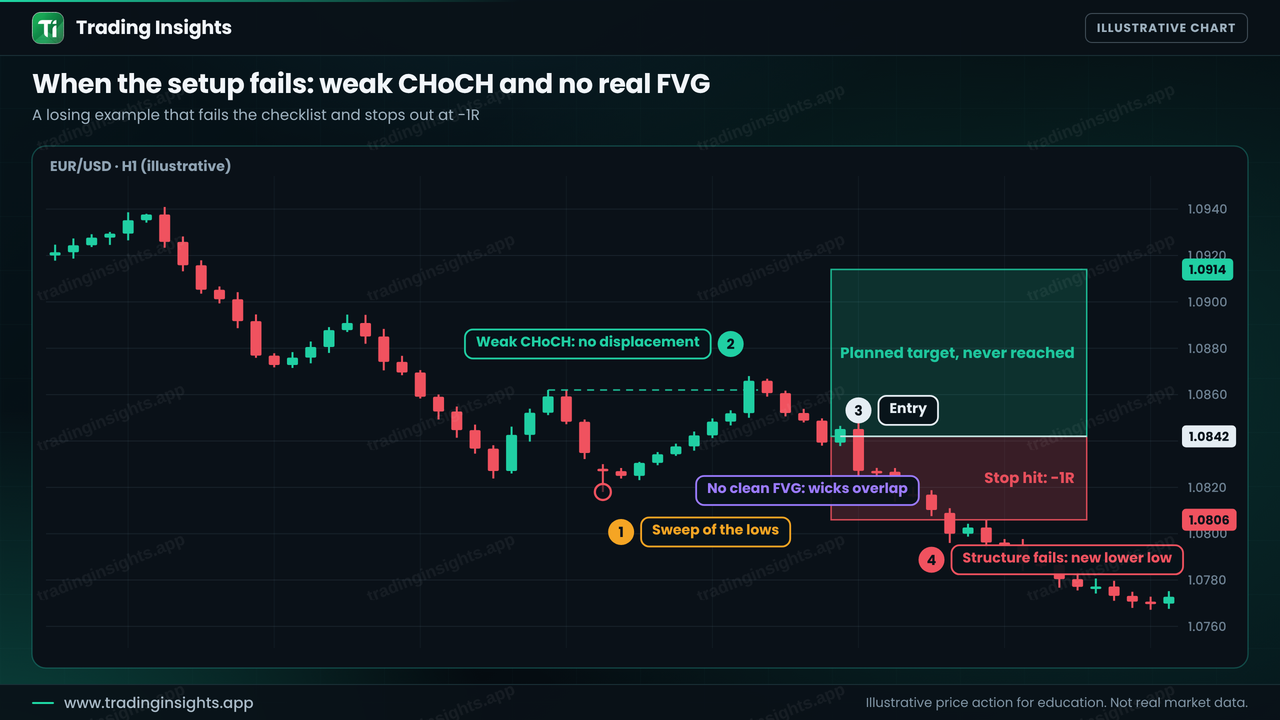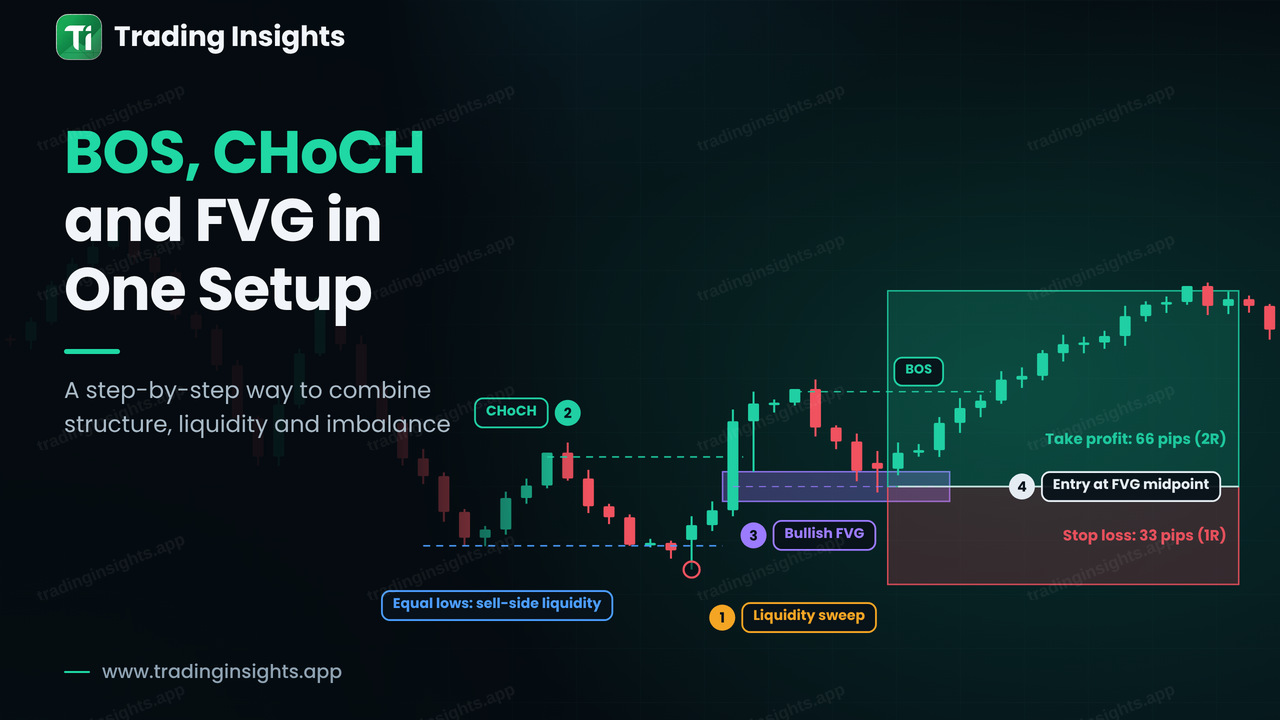
Break of structure (BOS), change of character (CHoCH) and fair value gap (FVG) are three of the most used terms in price action trading, and they are often taught separately. On a live chart they work as one sequence: CHoCH is the first warning, BOS is the confirmation, and the FVG is the area where you plan the entry. This guide shows how the three fit into a single setup, with a full bullish example, a bearish mirror, a checklist and a trade that fails. If the terms are new, read what market structure is and fair value gap (FVG) explained first.
Why combine three tools instead of using one
Each tool answers a different question, and each one alone leaves a gap. A BOS tells you price broke a swing, but not where to enter or where you are wrong. An FVG tells you where an imbalance exists, but a gap inside a ranging market means very little. A CHoCH tells you behaviour changed, but it can appear and fail within a few candles. Used together they filter each other.
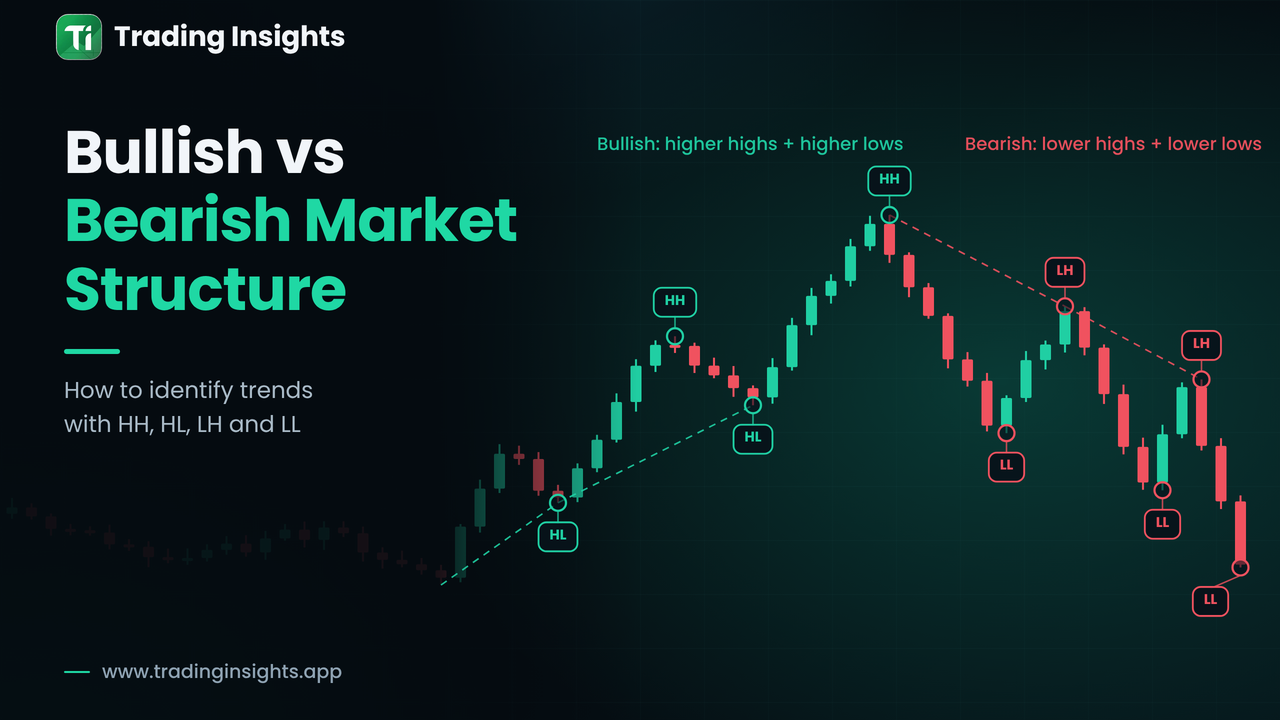
CHoCH answers: has the character of the move changed? In a downtrend, the first close above the last lower high is a CHoCH. It is an early warning, not a trade.
BOS answers: is the new direction confirmed? After a CHoCH, a close beyond the next swing in the new direction (for example above a previous high) shows continuation.
FVG answers: where can I enter with a defined risk? The strong move that breaks structure often leaves a three-candle imbalance, and price frequently returns to it.
A fourth ingredient, the liquidity sweep, gives the setup its context. Many good setups begin when price takes the stops sitting beyond equal highs or equal lows and then reverses. The sweep is why the CHoCH matters. You can read more in what a liquidity pool is.
The bullish sequence, step by step
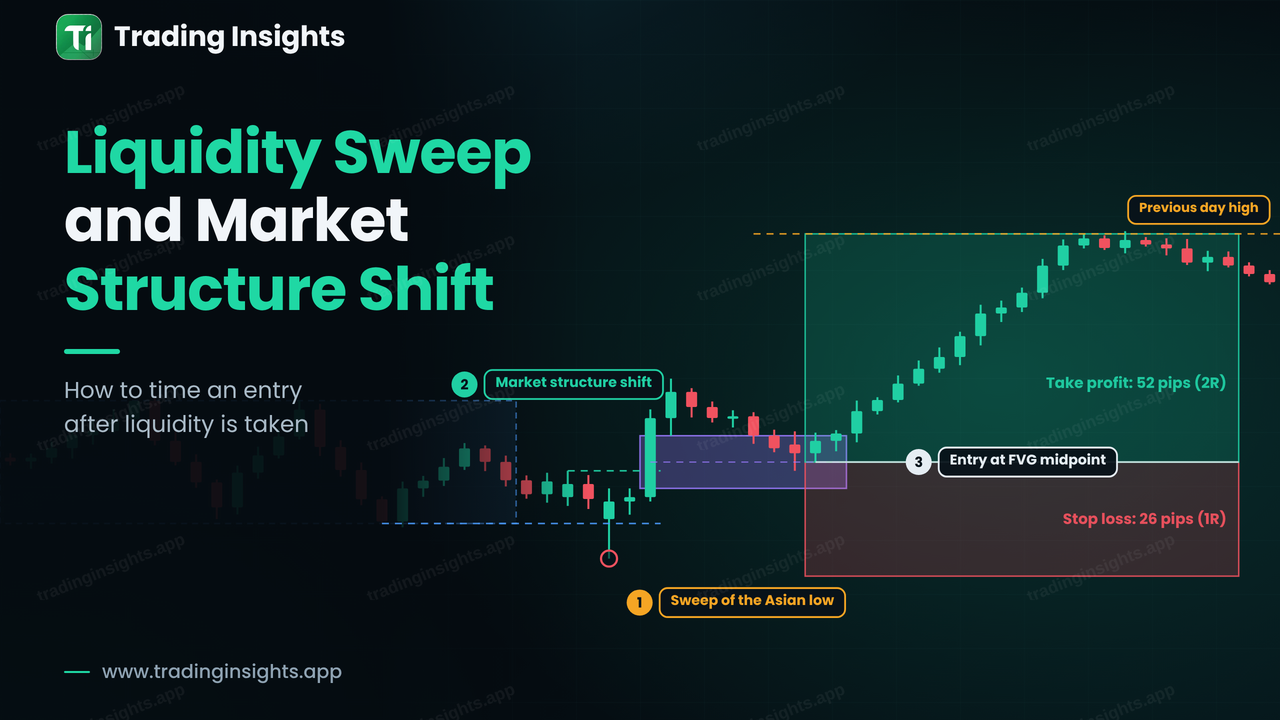
Here is a bullish example on EUR/USD, H1. The chart is illustrative. Read it from left to right.
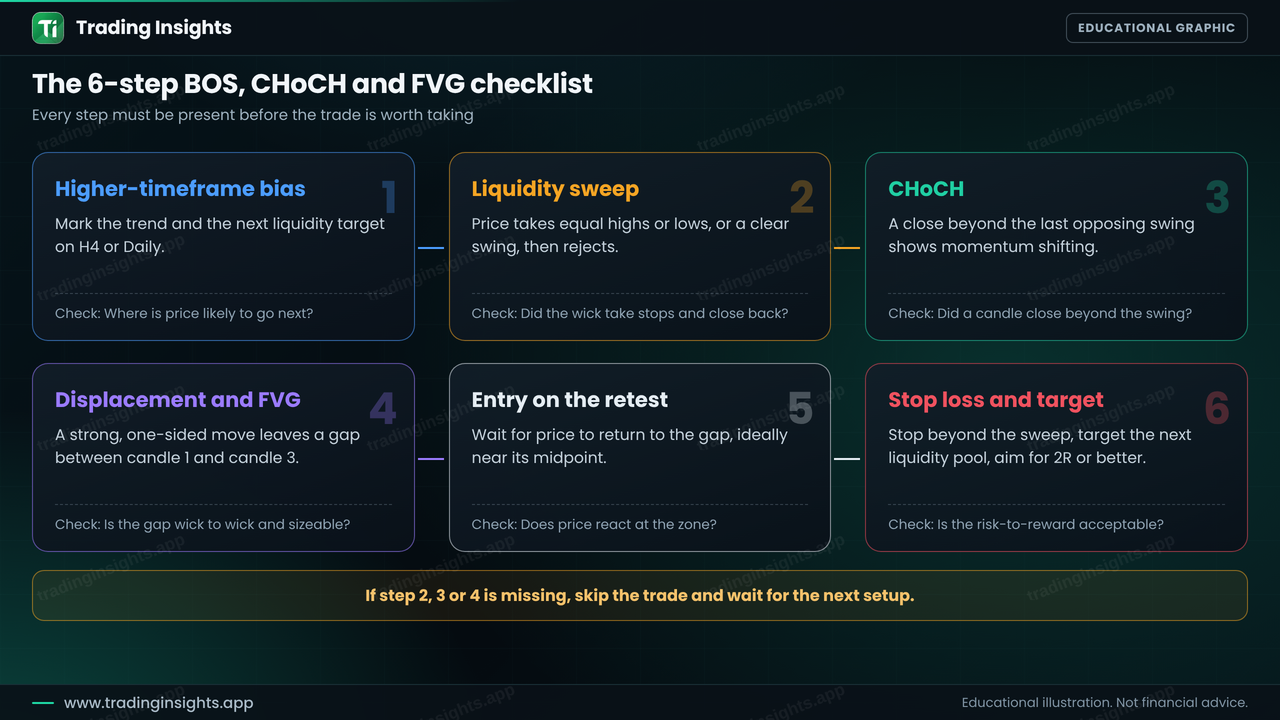
Bias: check a higher timeframe such as H4 or Daily. In this example price is falling into an area where a buy idea makes sense, such as a prior demand area or a clear pool of sell-side liquidity.
Sweep: price drops below a set of equal lows and quickly closes back above them. The stops under those lows have been taken.
CHoCH: price then closes above the last lower high. The sequence of lower highs is broken for the first time.
BOS and displacement: a strong candle pushes through the next swing high. The move is fast, one-sided and leaves an FVG between candle 1 and candle 3.
Entry on the retest: instead of chasing, you wait for price to return into the FVG and place the order near its midpoint.
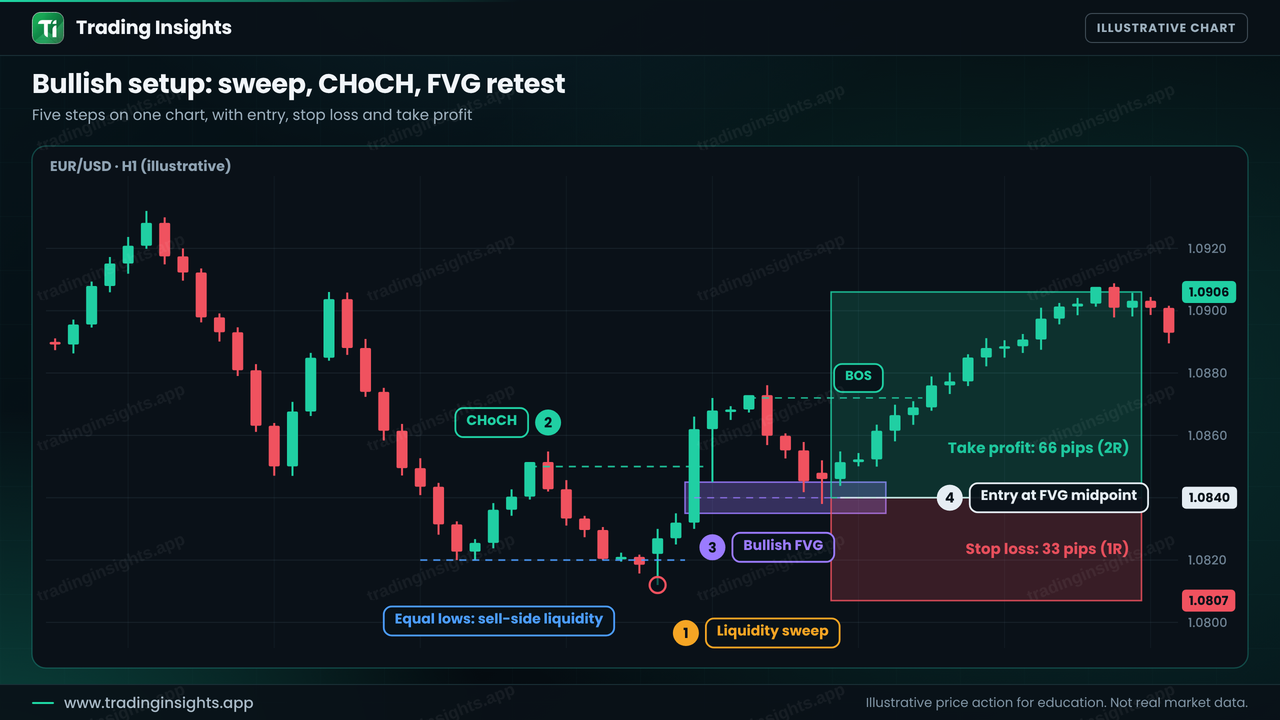
Figure 1: Bullish setup. Sweep of equal lows, CHoCH, BOS with displacement, then an entry at the FVG midpoint.
The numbers for the bullish example
In the chart, the entry is 1.0840, the stop loss is 1.0807 below the swept low and the take profit is 1.0906 near the next liquidity pool. The risk is 33 pips and the reward is 66 pips, a 1:2 ratio. With a $10,000 account and 1% risk ($100), the position size is $100 divided by (33 pips x $10 per pip per lot), which is about 0.30 lots. If you want to practise this calculation, see how to calculate risk-to-reward ratio.
The bearish mirror
The same logic works in reverse. On GBP/USD, price rises into equal highs, sweeps them, and closes back below. A CHoCH appears when price closes below the last higher low. A strong candle then breaks the next swing low, leaving a bearish FVG, and you sell on the retest.
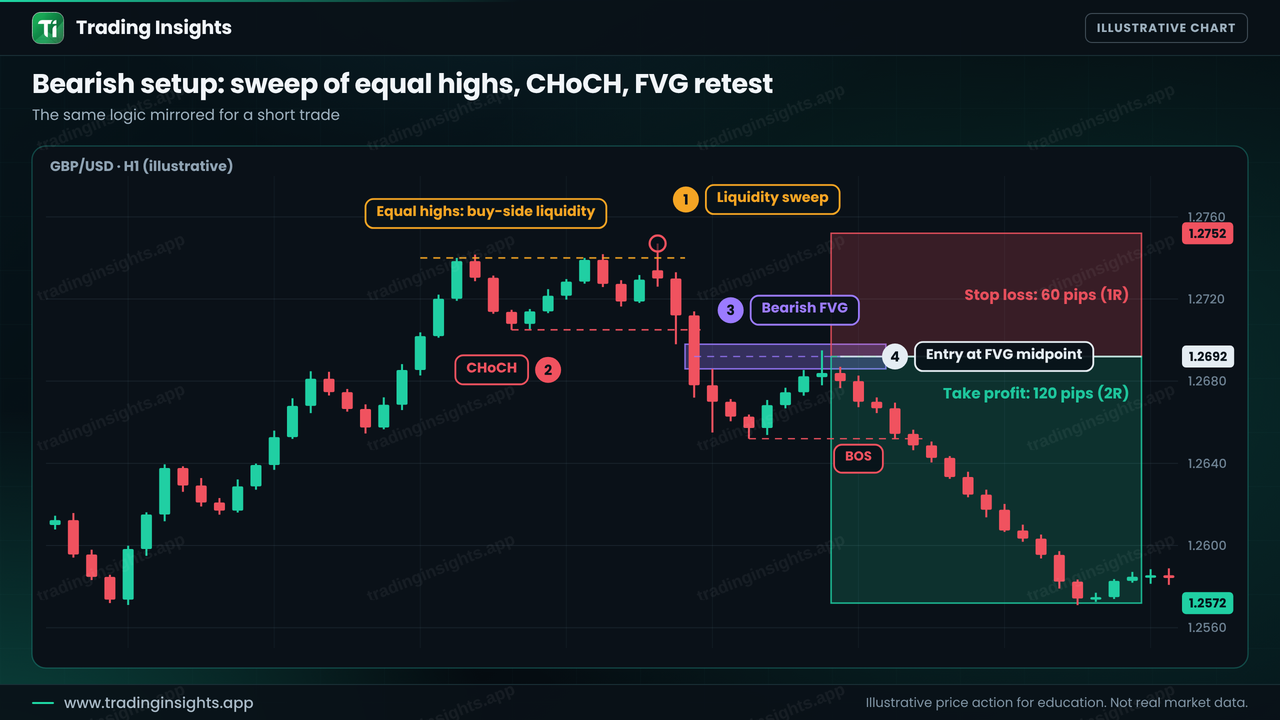
Figure 2: Bearish setup. Sweep of equal highs, CHoCH, BOS and a short entry on the FVG retest.
In this example the entry is 1.2692, the stop is 1.2752 above the swept high (60 pips) and the target is 1.2572 (120 pips), again 1:2. Because the stop is wider, the same 1% risk gives a smaller position of about 0.17 lots. This is the main idea of risk management: the stop distance decides the size, not the other way round.