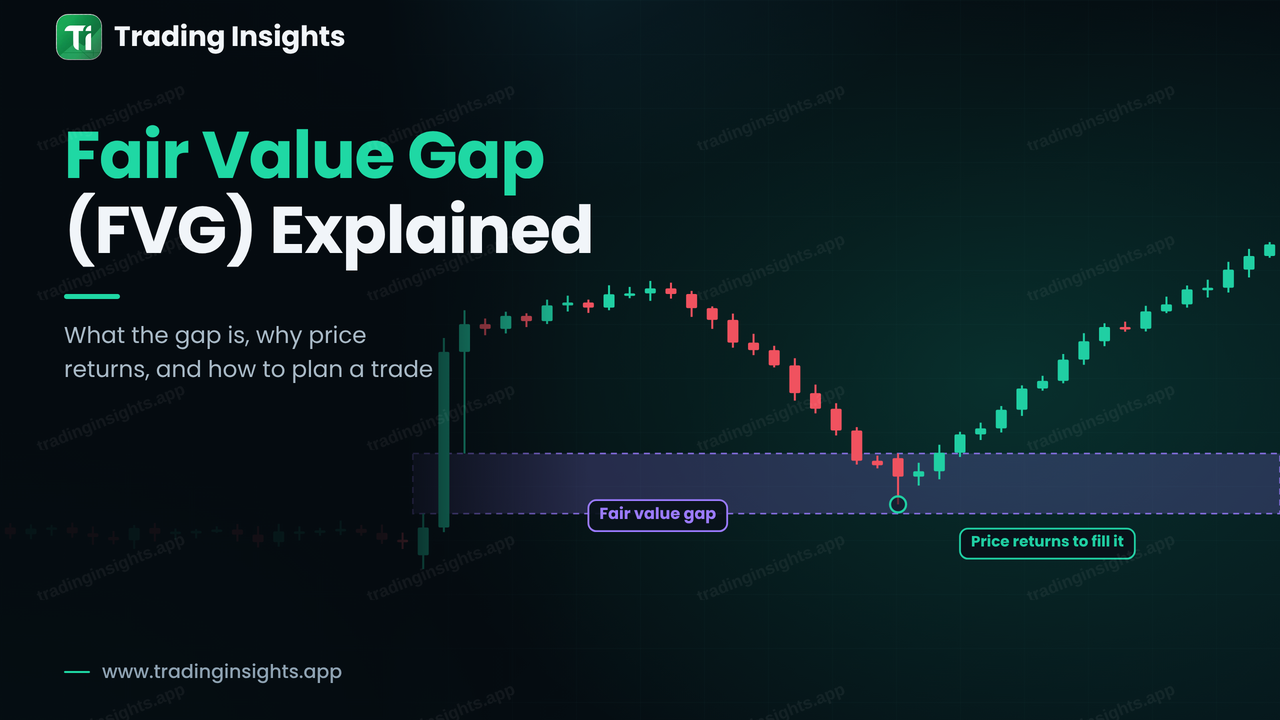
A fair value gap (FVG) is an area on a chart where price moved so quickly in one direction that it left an imbalance behind. It is identified with three consecutive candles: the wick of the first candle and the wick of the third candle do not overlap, and the space between them is the gap. Many traders watch these areas because price often returns to them before continuing, which can offer a defined place to plan an entry. This guide explains what an FVG is, how to mark bullish and bearish gaps, what can happen when price comes back, and how to turn one into a trade plan with a stop and a target.
What a fair value gap means
When buyers or sellers are strongly in control, price can move through an area with very little two-way trading. The market did not spend time there, so some orders in that area may remain unfilled. The idea behind an FVG is that price may revisit the area to trade it more fully before continuing. This is an idea about how orders could be left unmatched, and it is not a rule. Many gaps are never revisited, and some are ignored by price entirely. That is why an FVG is best treated as an area of interest, not a signal on its own.
The same concept is sometimes called an imbalance or an inefficiency. It is also different from the price gap you see on stock charts after a weekend or overnight, where the next candle opens away from the previous close. An FVG exists inside a continuous move, because it is defined by the wicks of three candles and not by a break between two sessions.
How to identify a fair value gap: the three-candle rule
To mark a gap, you look at three candles in a row. The middle candle is usually large and made the move, which is why it is often called a displacement candle. You can read more about this in what a displacement candle is.
Bullish FVG: the low of candle 3 is higher than the high of candle 1. The gap is the space between them.
Bearish FVG: the high of candle 3 is lower than the low of candle 1. The gap is again the space between them.
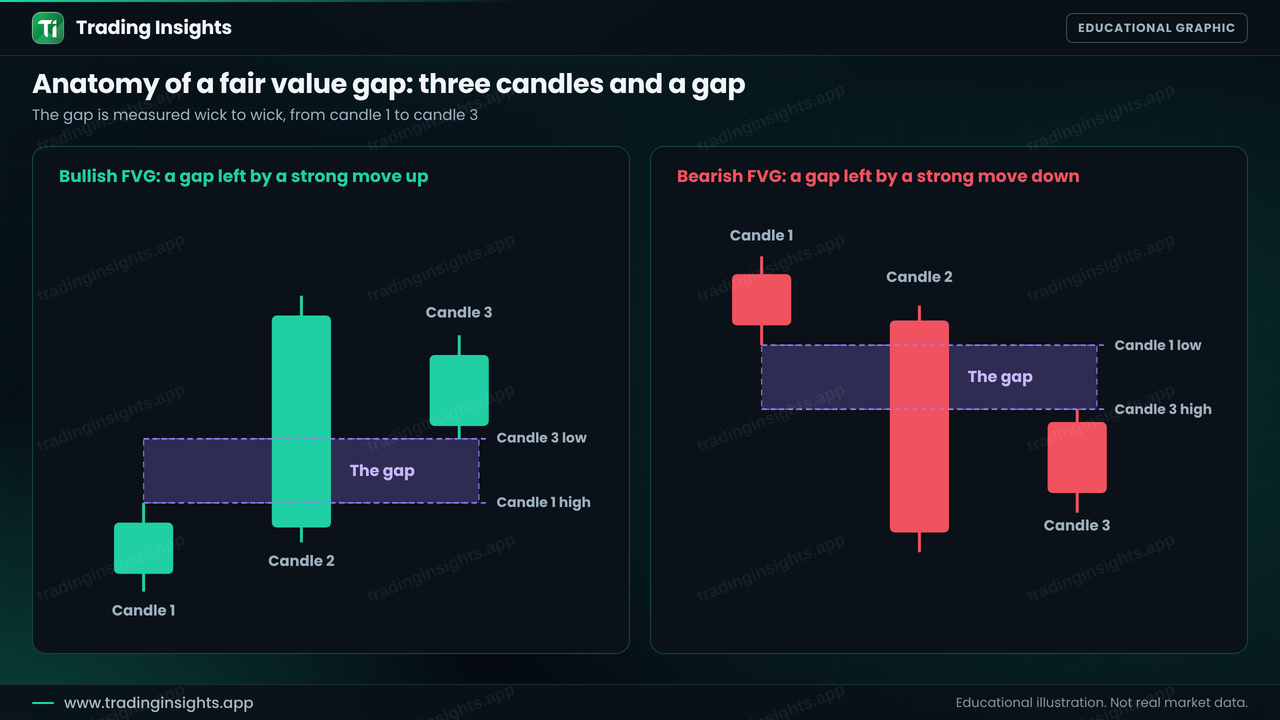
Figure 1: A bullish and a bearish fair value gap. The gap runs from the wick of candle 1 to the wick of candle 3, and candle 2 passes through it.
Draw a rectangle from the first candle's high (bullish) to the third candle's low and extend it to the right. The halfway point of that rectangle is called the consequent encroachment (CE), or the 50% level, and many traders use it as a reference for entries. Note that if the candle wicks overlap, there is no gap, even if the bodies leave a space.
Why price often returns to a gap
There are two common explanations, and they support each other. The first is the unfilled-orders idea above. The second is more practical: after a fast move, many traders who missed it wait for a pullback, and a gap provides an obvious place to wait. When many participants watch the same area, price often reacts there. This does not mean it will always do so. A gap inside a strong trend may hold, while a gap in the middle of a range, or against the larger trend, is much less reliable. For the larger picture, read what market structure is and bullish vs bearish market structure.
What can happen when price returns to the gap
When price comes back, there are three typical outcomes. Planning for all three is what separates a trade plan from a hope.
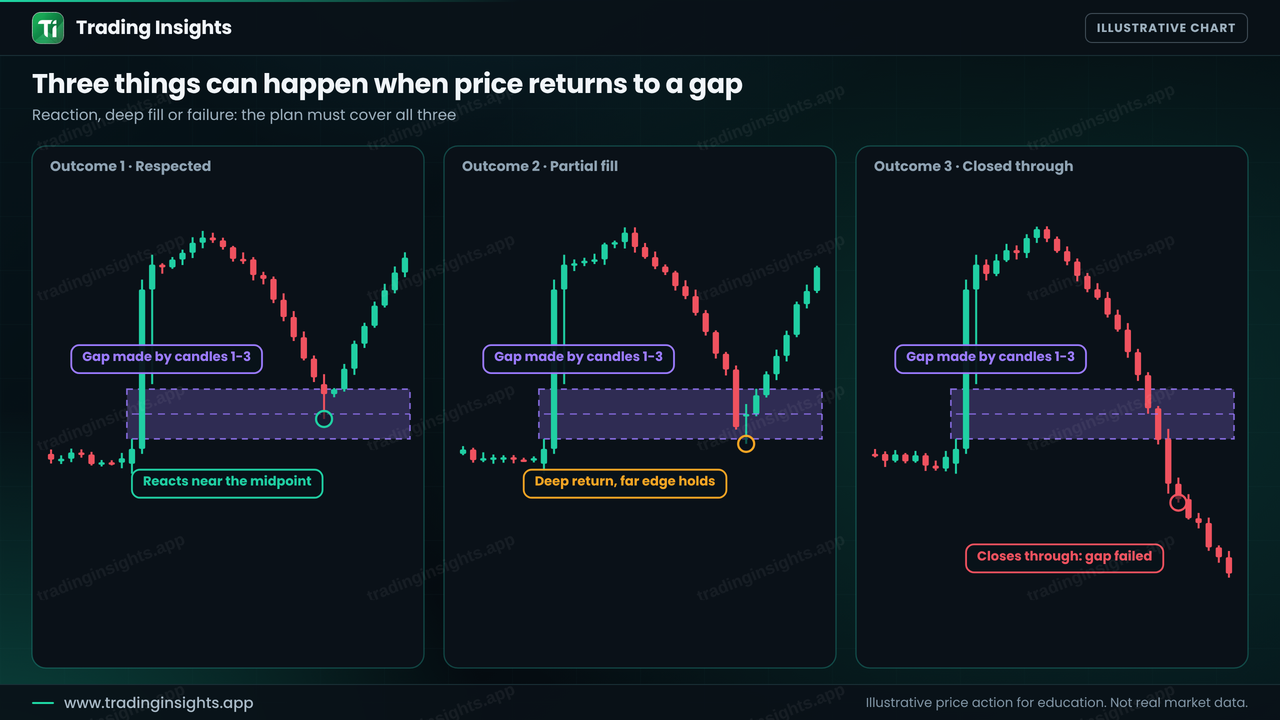
Figure 2: Three outcomes. Price can react near the midpoint, fill most of the gap and still hold, or close through it.
Respected: price enters the gap, reacts near the midpoint and continues in the original direction. This is the outcome most traders hope for.
Partial or deep fill: price goes further into the gap, perhaps to the far edge, and then continues. A stop placed only at the midpoint would be hit here, which is why the stop is usually placed beyond the whole gap.
Closed through: a candle closes beyond the whole gap. Many traders treat the gap as failed at this point, and the stop does its job.
Trading a bullish FVG: a worked example
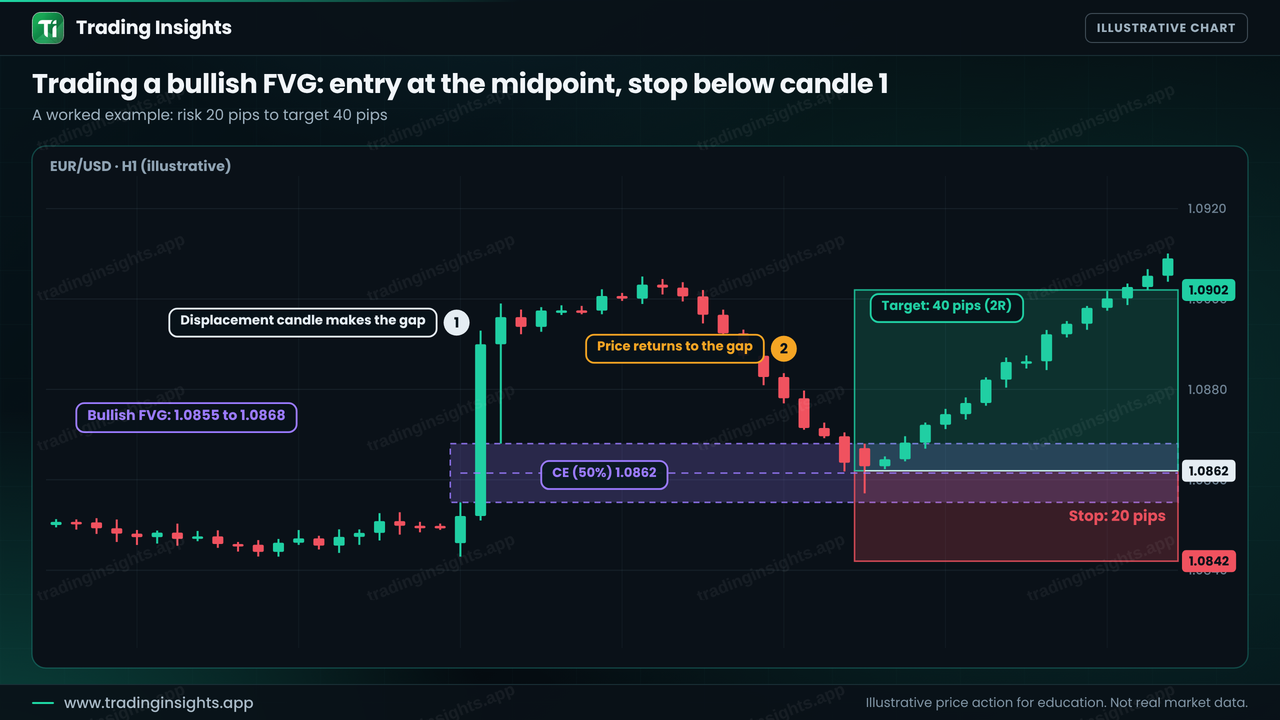
Here is a simple plan for a bullish gap on EUR/USD, H1. The numbers are illustrative. A large candle pushes price up from a quiet area. The high of candle 1 is 1.0855 and the low of candle 3 is 1.0868, so the gap is 13 pips wide, with its midpoint at about 1.0862. Price then continues up to a swing high and pulls back.