External range liquidity (ERL) is the pool of orders resting beyond the high and low of a defined range. Internal range liquidity (IRL) is the set of reference points inside that range, such as fair value gaps, minor swing points and the midpoint. Many traders describe price as moving back and forth between the two: first toward something inside the range, then toward something outside it.
Start with the dealing range
Both terms depend on a reference range, often called the dealing range. It is usually drawn from a significant swing low to a significant swing high (or the reverse). The edges of that range are the external levels, and everything between them is internal. If you change the range, you change what counts as internal or external, so always state which range you are using. If swings are new to you, read what market structure is first.
What is external range liquidity (ERL)?
ERL is liquidity located outside the range. Above the range high sits buy-side liquidity, made of stop-losses from short positions and breakout buy orders. Below the range low sits sell-side liquidity. These are the obvious, high-visibility levels that a trader can see in one glance, which is why many view them as bigger targets. The general idea behind these pools is covered in what a liquidity pool is.
What is internal range liquidity (IRL)?
IRL is everything of interest inside the range. Typical examples are:
Fair value gaps left by fast moves within the range.
Minor swing highs and lows that formed during pullbacks.
The 50% level (equilibrium) of the range.
Order blocks and other zones formed during the leg that created the range.
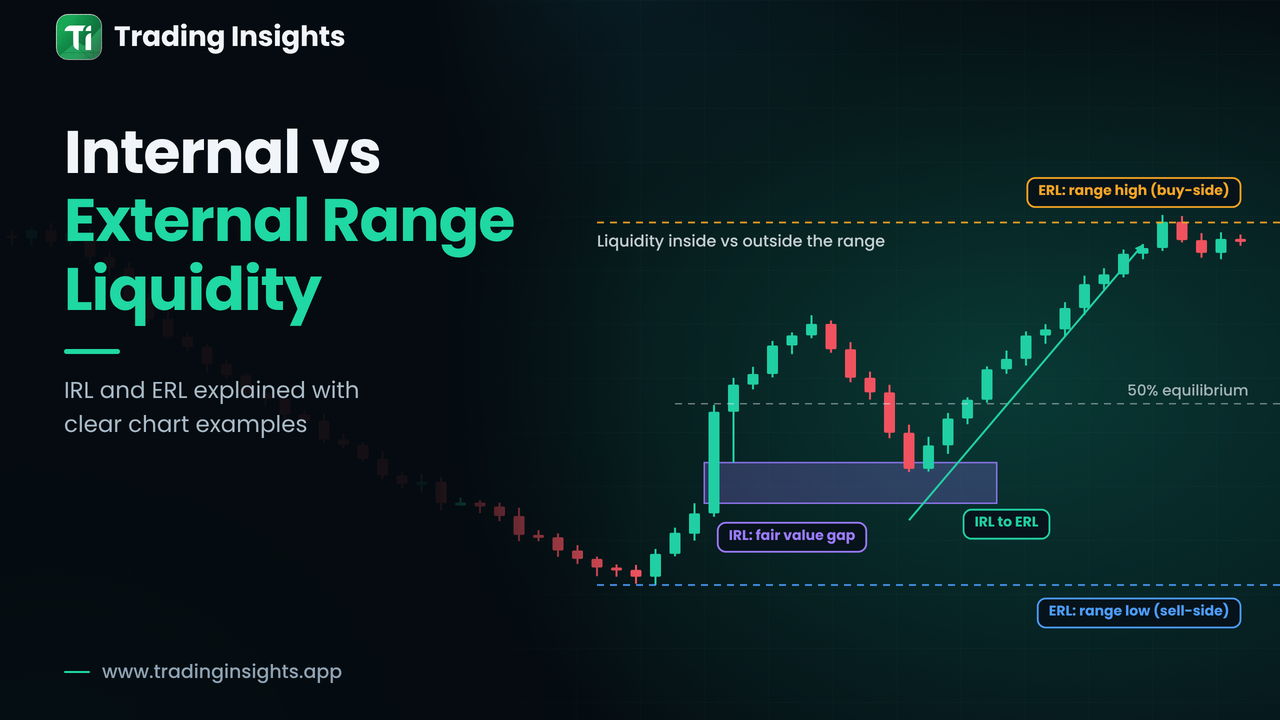
The chart below shows both on one range. The dashed amber lines are external. The purple gap, the minor swing high and the dotted midpoint are internal.
Figure
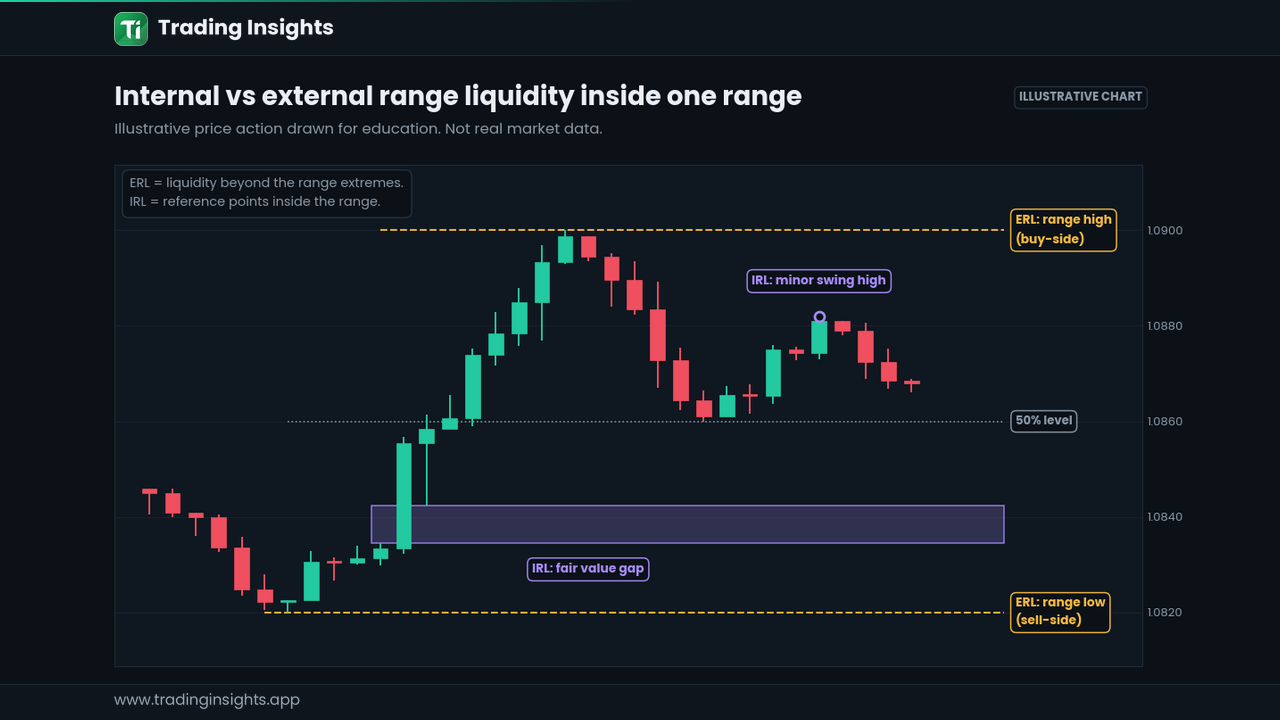
1: ERL marks the range extremes; IRL marks the reference points inside.
ERL | IRL | |
|---|---|---|
Location | Beyond the range high or low | Inside the range |
Typical examples | Range high, range low, equal highs/lows at the edges | Fair value gaps, minor swings, midpoint |
Visibility | Very obvious | Often needs closer inspection |
Role in the model | Larger target or reversal area | Pullback point or short-term target |
The IRL-to-ERL idea
One common framework says price is repeatedly drawn from one type of liquidity to the other. After an impulse, price may return to an internal point, such as a gap, to rebalance and gather orders. From there it may extend toward the external level, taking the highs or lows. Then the process can reverse. In the sequence below, price returns into a fair value gap (1), reacts (2), and then reaches the range high (3).
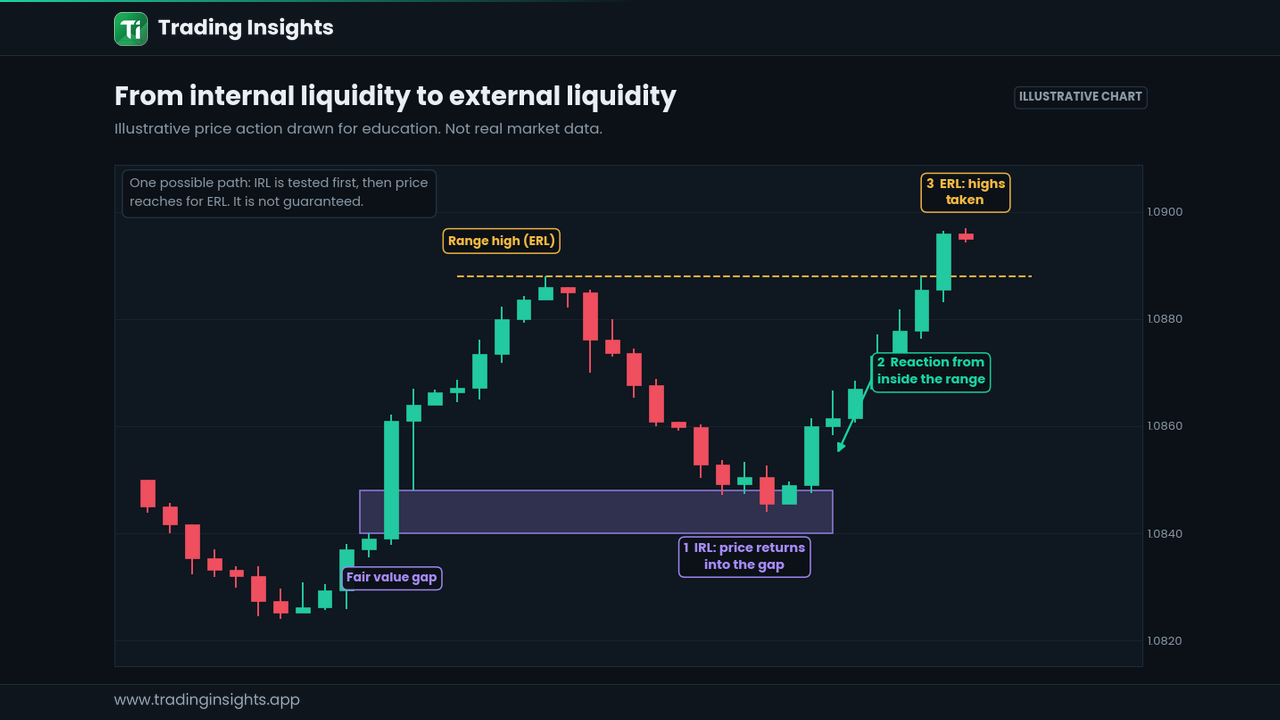
Figure 2: One possible path: an internal test first, then a move toward the external high.
Treat this as a model, not a rule. Price does not have to visit IRL before ERL, and a reach for ERL can be a continuation or the end of a move.
How to map IRL and ERL step by step
Choose the range. Pick the most recent significant swing high and swing low on your timeframe.
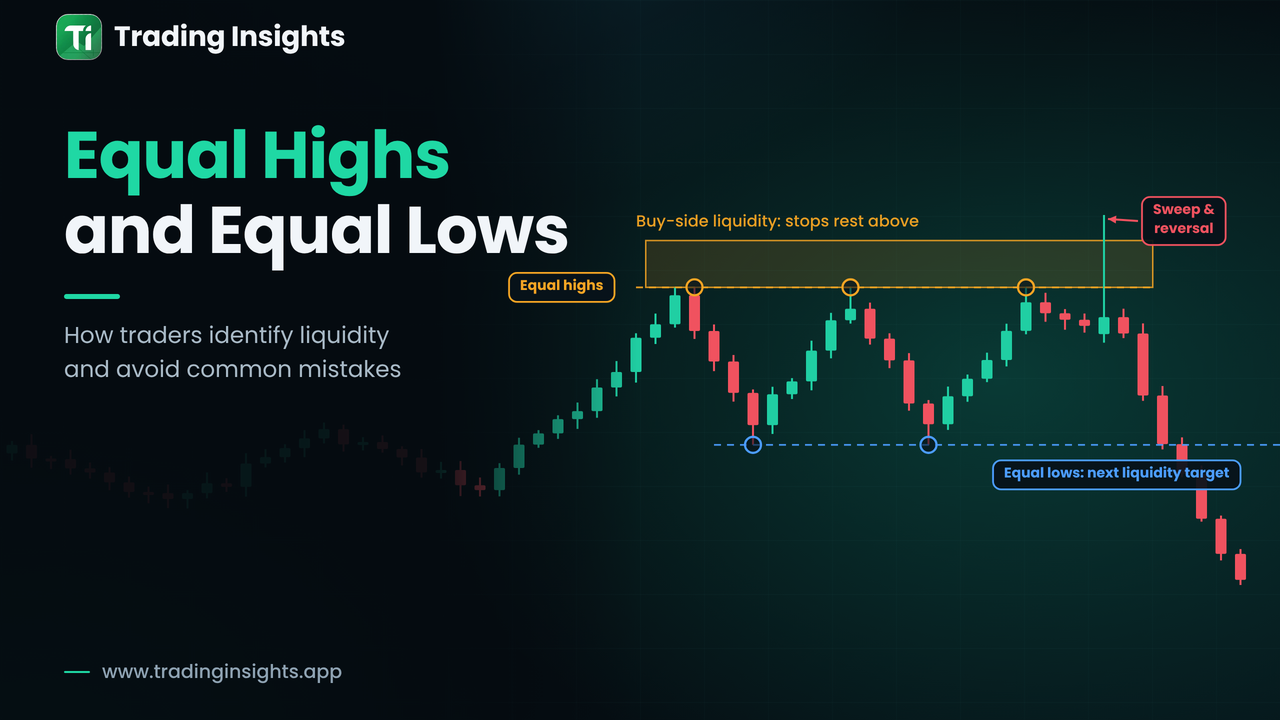
Mark ERL. Draw lines at the range high and low, and note any equal highs or lows nearby (see equal highs and equal lows).
Mark IRL. Add unfilled fair value gaps, the midpoint and minor swings. The checklist in how to identify a valid fair value gap helps you keep only the meaningful ones.
Decide the current draw. If price has just taken ERL, the next draw may be inside the range. If it is tapping IRL, ERL may be the next reference.
Look for confirmation. Wait for a structure break or a sharp reaction before treating any level as important.
What happens after ERL is taken?
Two outcomes are common. Price may sweep the level, close back inside the range and reverse toward the opposite side. Or it may close beyond the level, hold, and start a new range. Telling the two apart usually depends on the close, the speed of the move and what structure does next. The sweep-versus-breakout question is explored further in inducement vs liquidity sweep.
Common mistakes
Switching ranges mid-analysis so that a level changes from internal to external.
Marking every tiny gap as IRL. Only meaningful, unfilled gaps are worth tracking.
Assuming ERL is always reached. It is a reference, not a promise.
Ignoring the higher timeframe. A range on M5 may sit inside a much larger one.
Frequently asked questions
Is ERL the same as support and resistance?
They often overlap, but the focus differs. ERL looks at the orders resting beyond the level rather than at the bounce from it.
Do I need both IRL and ERL for every trade idea?
No. They are a way to describe where price is and where it may be heading. Some traders use only one of the two as a reference.
Which timeframe should I use?
Define the range on a higher timeframe to find direction, then use a lower timeframe to look at internal detail. Keep notes on which range each level belongs to.
This article is for education only and is not financial advice. Trading carries risk, and these frameworks do not predict future price.