Market structure is the order in which price makes its swing highs and swing lows. Read in sequence, those turning points tell you whether a market is trending up, trending down or moving sideways, and exactly where that picture would change. It is the first layer of price-action analysis: before you think about entries, zones or indicators, you need to know what the market is actually doing.
Market structure in simple words
Price never travels in a straight line. It pushes in one direction, pulls back, then pushes again. Every push and pullback leaves a turning point on the chart, and market structure is nothing more than the sequence of those turning points. When they keep climbing, buyers are in control. When they keep falling, sellers are. When they keep returning to the same levels, neither side is winning.
A useful way to think about it: a single candle is a letter, a swing is a word, and the sequence of swings is the sentence that tells you the story of the market.
The building blocks: swing highs and swing lows
A swing high is a candle whose high is higher than the highs of the candles on both sides of it. A swing low is the mirror image: a low that sits below the lows around it. Beginners usually start with one candle on each side. If a chart looks noisy, require two or three candles on each side so that only meaningful turns are marked.
Once swings are marked, each new one is compared with the previous swing of the same type:
Higher high (HH): a swing high above the previous swing high.
Higher low (HL): a swing low above the previous swing low.
Lower high (LH): a swing high below the previous swing high.
Lower low (LL): a swing low below the previous swing low.
The chart below shows the full idea on a simple rally. Follow the numbers from left to right: the market makes a low, a high, then a higher low and a higher high, and repeats the pattern. That repeating sequence is what traders call an uptrend.
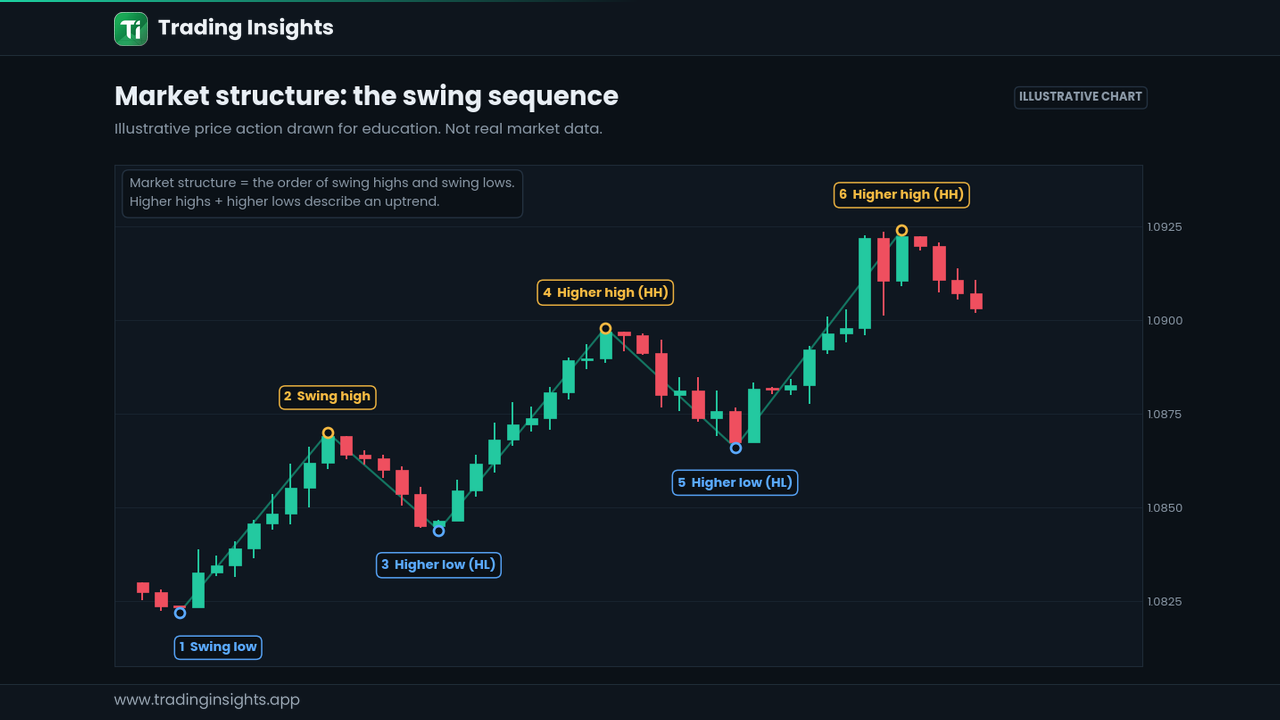
Figure 1: An illustrative uptrend. Each numbered swing is compared with the one before it.
The three states of market structure
Uptrend: a series of higher highs and higher lows. Pullbacks stop above the previous low.
Downtrend: a series of lower highs and lower lows. Rallies stop below the previous high.
Range: swings that keep reversing near the same highs and lows, so there is no clear directional sequence.
Most of the time a market is doing one of these three things. The skill is not predicting which comes next but labelling the current state honestly. If you cannot clearly see HH/HL or LH/LL, the answer is usually "range", and that is a perfectly valid conclusion. For a deeper look at the two trending states, see bullish vs bearish market structure.
Break of structure (BOS) and change of character (CHoCH)
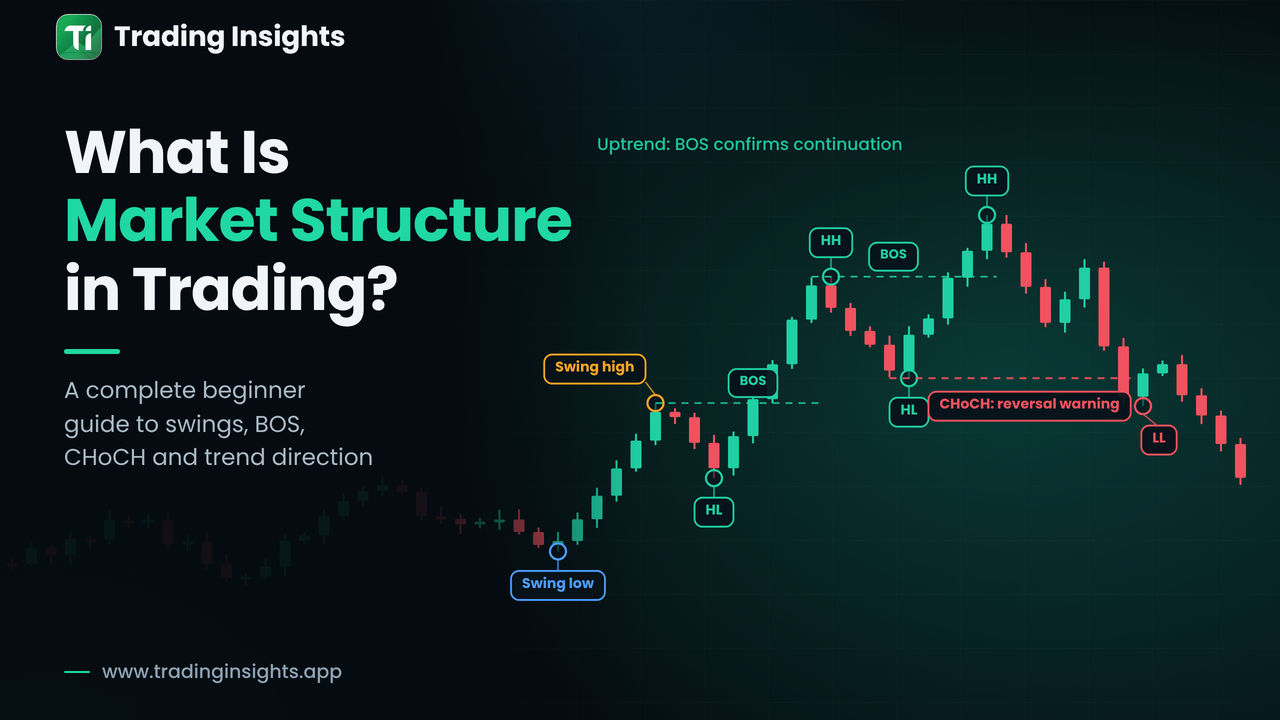
Structure is only useful if you know when it changes. Two terms cover this. A break of structure (BOS) happens when price closes beyond the last swing in the direction of the trend, for example a close above the previous swing high in an uptrend. It tells you the trend is continuing. A change of character (CHoCH) is the first close through the swing that was holding the trend together, such as a close below the last higher low in an uptrend. It is an early warning that control may be shifting. Some traders call the same event a market structure shift (MSS).
In the example below, the first two BOS labels confirm the uptrend. After the second high, price falls and closes under the last higher low. That is the CHoCH, and the sequence that follows (a lower high, then a lower low) shows the new direction.
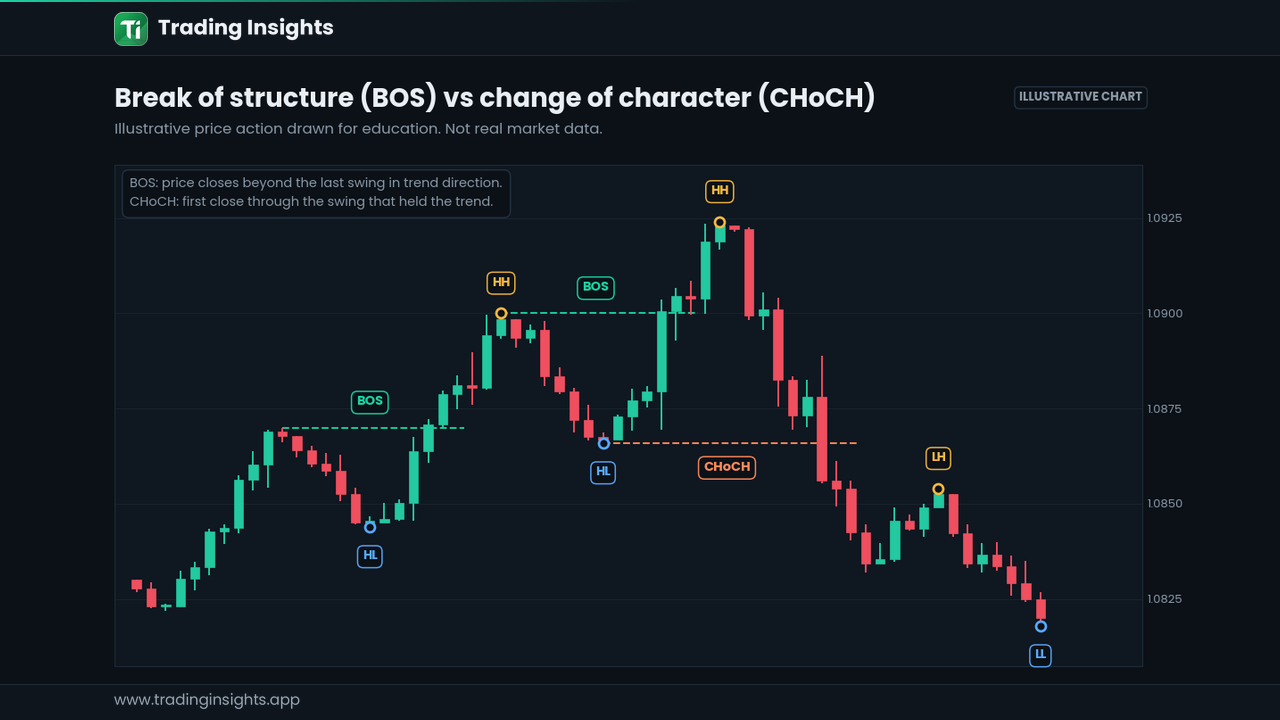
Figure 2: Two BOS labels confirm the trend, then a CHoCH marks the first sign of a change.
Term | What breaks | What it suggests |
|---|---|---|
BOS | The last swing in the direction of the trend | The trend is continuing |
CHoCH | The swing that was protecting the trend | Control may be shifting, so wait for confirmation |
What a range looks like
In a range, price bounces between a clear high and a clear low without building a directional sequence. Ranges matter because they store orders on both sides, and the way price leaves them often sets the next structure. A close beyond the range boundary is a first clue, but traders usually want to see the move hold and build new swings before calling a new trend.
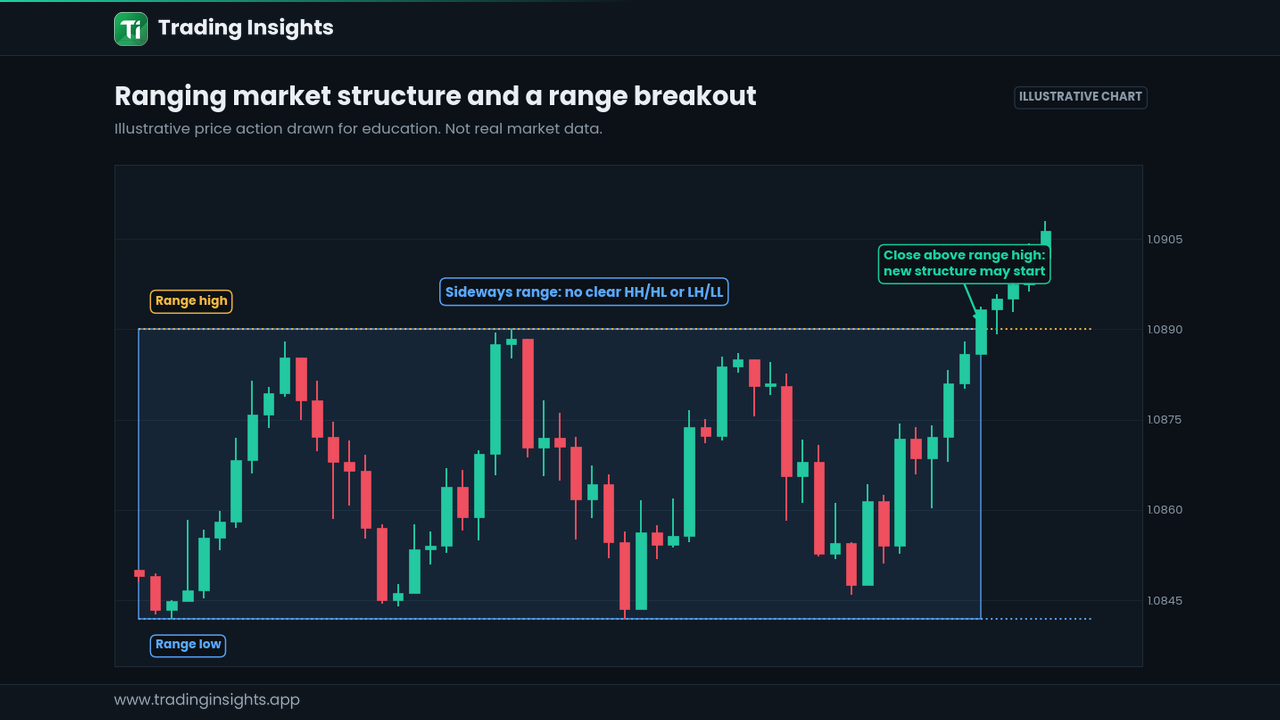
Figure 3: A range with no clear HH/HL or LH/LL, then a close above the range high.
How to read market structure step by step
Pick one timeframe. Start with a higher timeframe such as H4 or Daily to see the bigger picture, then move down.
Mark every clear swing high and swing low. Use the same rule each time (one, two or three candles on each side).
Label the sequence. Write HH, HL, LH or LL against each swing.
Find the protective swing. In an uptrend this is the last higher low, in a downtrend the last lower high.
Judge breaks by closes. A wick beyond a level is information, but a candle close beyond it is what most traders use to confirm a BOS or CHoCH.
Check for context. Look at what created the move: a sharp displacement candle carries more weight than a slow drift.
How market structure connects to other concepts
Structure rarely works alone. Swing points are also where stop orders cluster, which is the idea behind a liquidity pool. A brief poke through a swing that quickly reverses is not always a real break, and the difference between a trap and a genuine move is explained in inducement vs liquidity sweep. Gaps left by fast moves are covered in our guide to the valid fair value gap.
Common mistakes beginners make
Marking every tiny wiggle as a swing, which fills the chart with meaningless labels.
Calling a trend change after a single wick through a level.
Forcing a trend label onto a clear range.
Mixing timeframes, for example a lower-timeframe CHoCH inside a higher-timeframe uptrend, without noting the difference.
Treating structure as a prediction. It describes what has already happened and what would change the picture.
Frequently asked questions
Is market structure the same as trend?
Trend is the conclusion; market structure is the evidence. The sequence of swings is what lets you say a market is trending.
Which timeframe is best for market structure?
There is no single best timeframe. Many traders read direction on a higher timeframe (H4, Daily) and refine on a lower one (M15, H1). Always state which timeframe your structure label belongs to.
Do wicks or closes confirm a break?
Both approaches exist. Closes are more conservative and filter out brief spikes, which is why they are common for confirming a BOS or CHoCH.
Can market structure be used on stocks, crypto and indices?
Yes. Swings are a feature of any freely traded market, so the same reading method applies, although volatility and session behaviour differ.
This article is for education only and is not financial advice. Trading carries risk, and no method of reading charts guarantees profits.