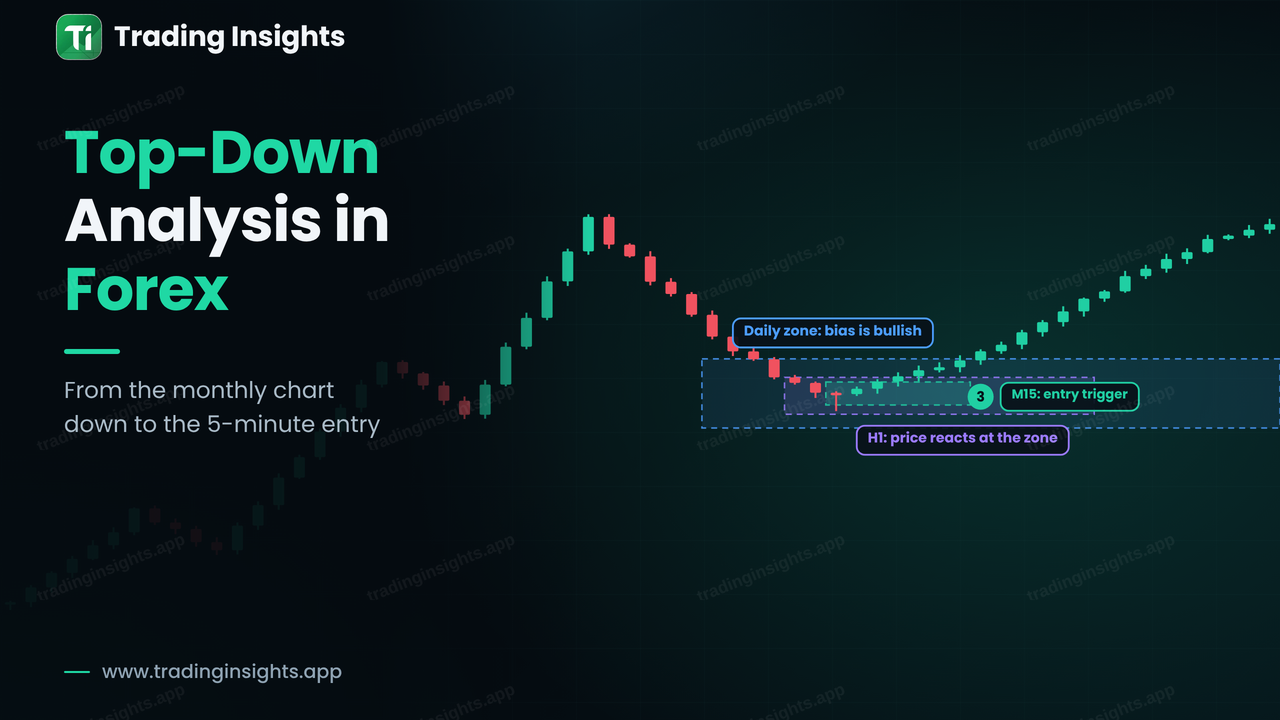
Top-down analysis means starting with the highest timeframe to understand the big picture, then moving down step by step until you find a precise entry. The reason is simple. A small chart shows you detail but hides context, and a large chart shows you context but is too coarse to time an entry. Using both gives you direction from the large chart and timing from the small one. This guide explains what each timeframe is for, how many you actually need, and how to follow one idea from the Daily chart to the 15-minute entry.
Why one timeframe is not enough
A 15-minute chart can show a perfect buy setup while the Daily chart is in a strong downtrend and sitting under a major resistance zone. Without the larger chart, you would not know that the buy is going against the main flow. The opposite also happens: the Daily chart tells you where price may turn, but the Daily candle is too wide to show where to place a stop of reasonable size. Top-down analysis solves both problems by giving each timeframe one job.
The timeframe ladder
The ladder below shows the typical timeframes and the question each one answers. They fall into three groups: where to trade, what to trade and when to trade.
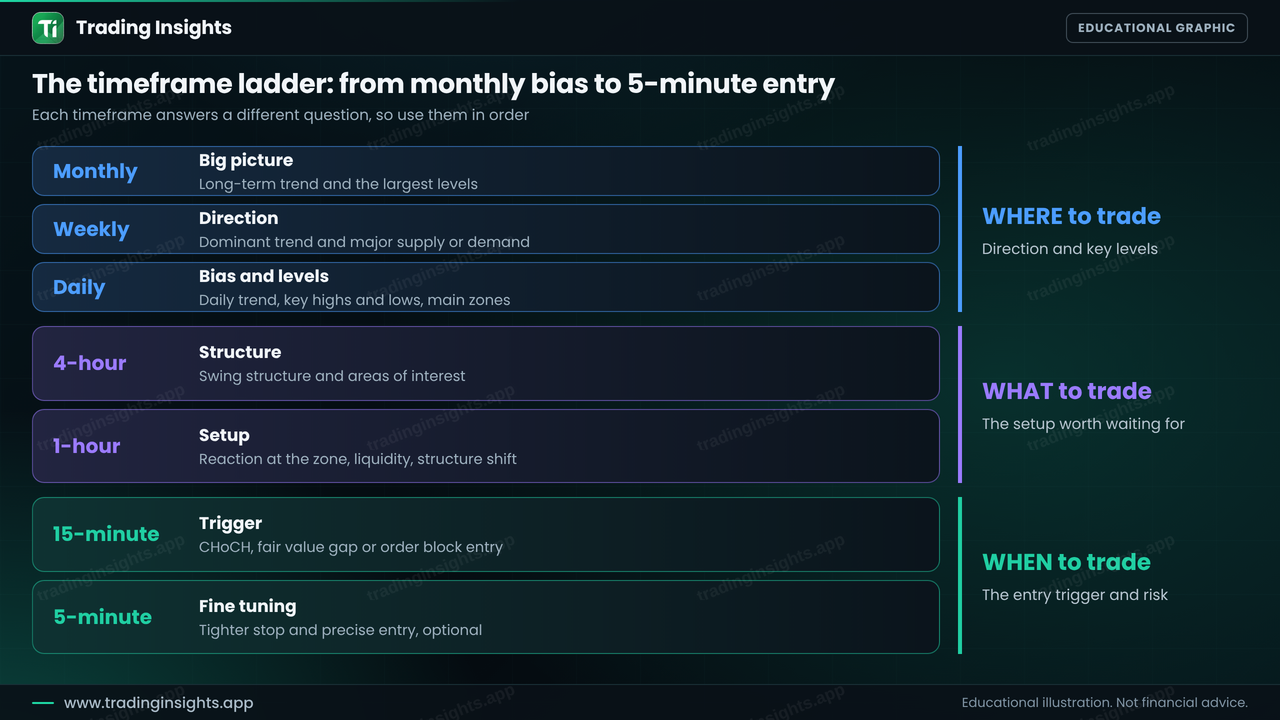
Figure 1: The timeframe ladder. Each timeframe answers a different question, so use them in order.
Timeframe | Its job | What you look for |
|---|---|---|
Monthly | Big picture | Long-term trend and the largest levels |
Weekly | Direction | Dominant trend and major supply or demand |
Daily | Bias and levels | Daily trend, key highs and lows, main zones |
4-hour | Structure | Swing structure and areas of interest |
1-hour | Setup | Reaction at the zone, liquidity, structure shift |
15-minute | Trigger | Change of character, fair value gap or order block entry |
5-minute | Fine tuning | Tighter stop and precise entry (optional) |
You do not need all seven
Seven charts for every trade is too much for most people. A practical approach is to choose three timeframes with a ratio of about four to six between them, then use them consistently. Common sets are:
Swing trading: Weekly for direction, Daily for the setup, H4 for the entry.
Day trading: Daily for bias, H1 for the setup, M15 for the entry.
Scalping: H1 for bias, M15 for the setup, M5 for the entry.
The right set is the one that matches how long you want to hold trades. A day trader holding for hours has little use for a monthly chart beyond a quick glance at major levels.
Step 1: Daily chart, find the bias
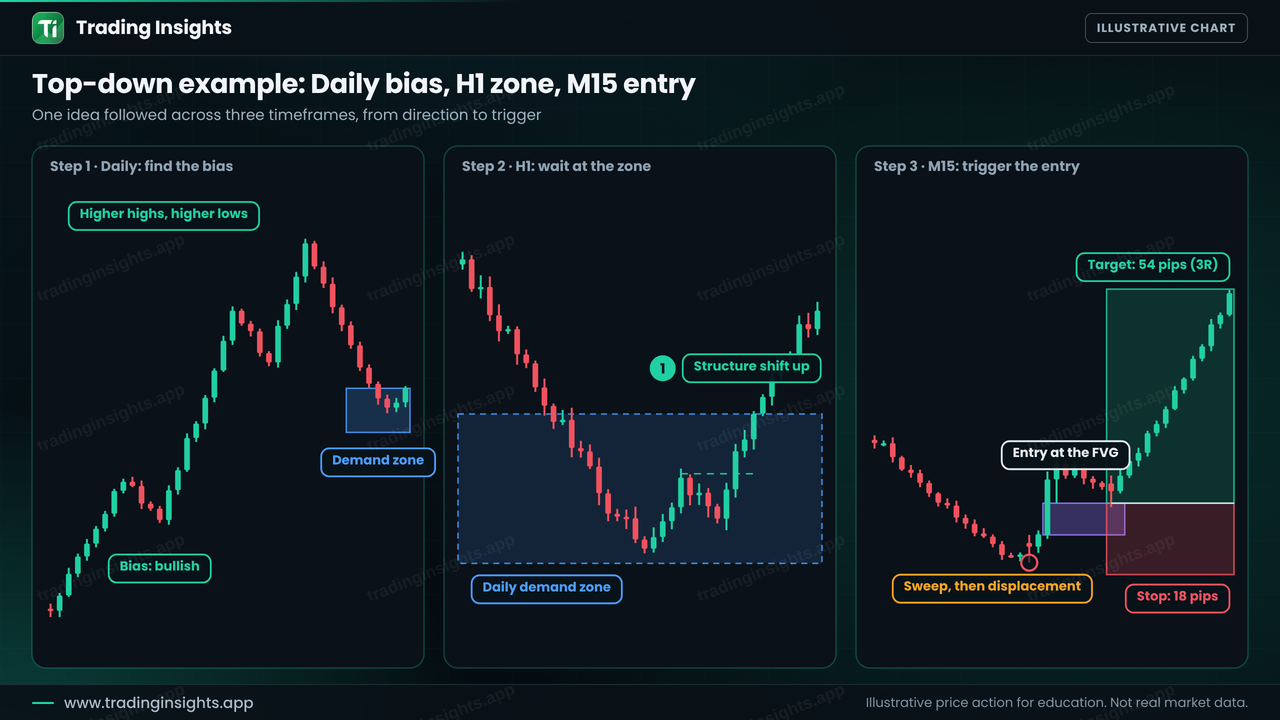
Start by asking one question: is the market making higher highs and higher lows, lower highs and lower lows, or ranging? If you need a refresher, read what market structure is and bullish vs bearish market structure. Then mark the nearest important zone in the direction of the bias, such as a demand zone below price if you want to buy. At the end of this step you should be able to say in one sentence: "The bias is bullish, and I want to buy near this zone."
Step 2: H1 chart, wait at the zone
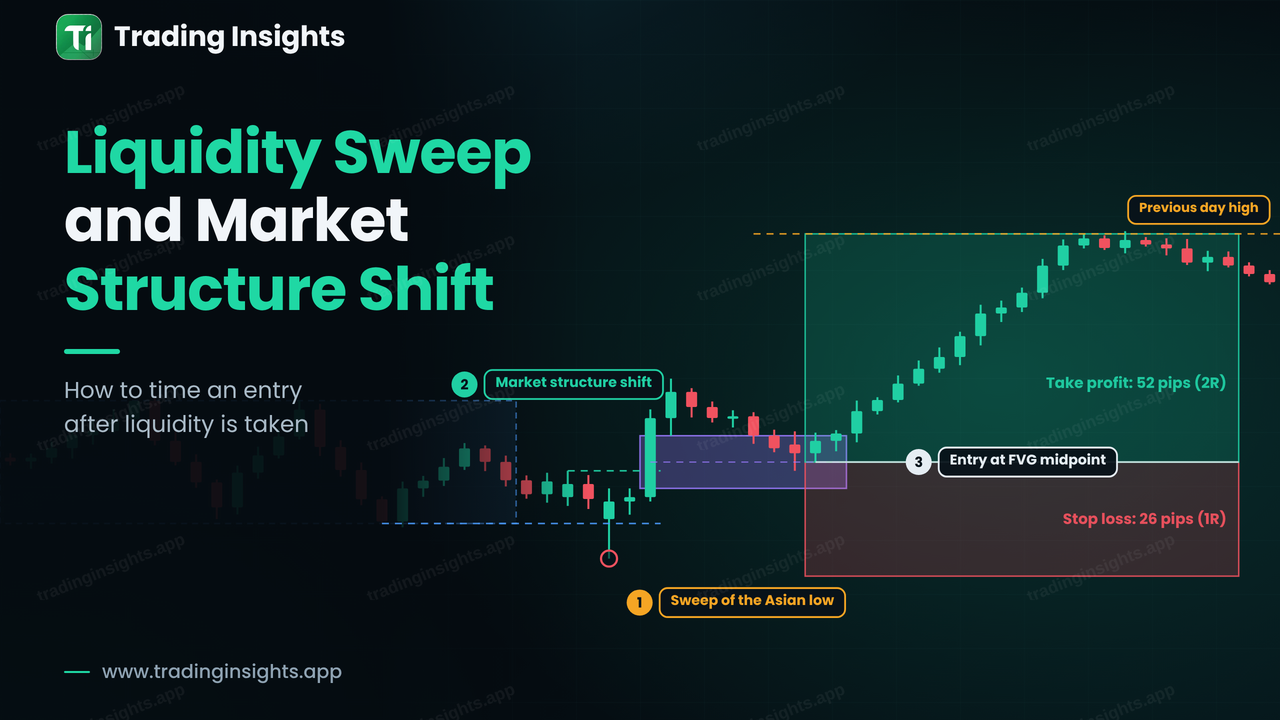
Move down to the H1 chart and watch what price does when it reaches the Daily zone. You are not entering yet. You are waiting for evidence, such as price sweeping liquidity below a low and then shifting structure upward. See liquidity sweep and market structure shift for how this looks.