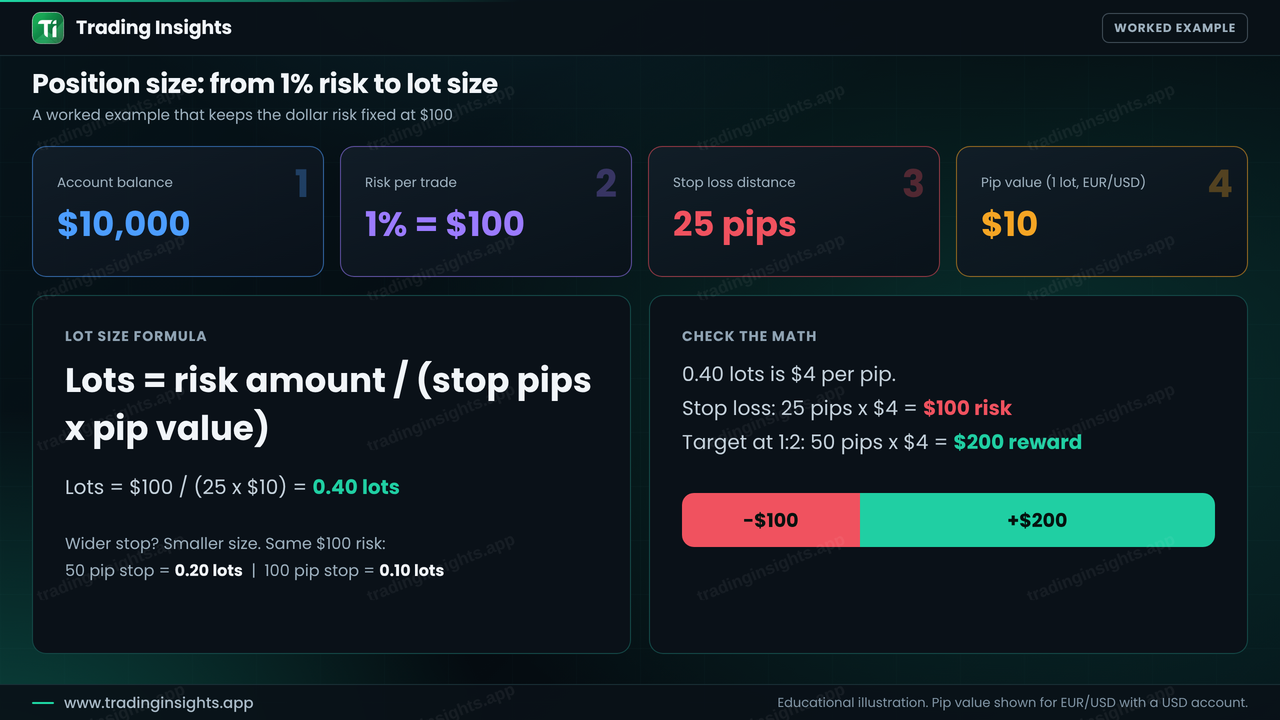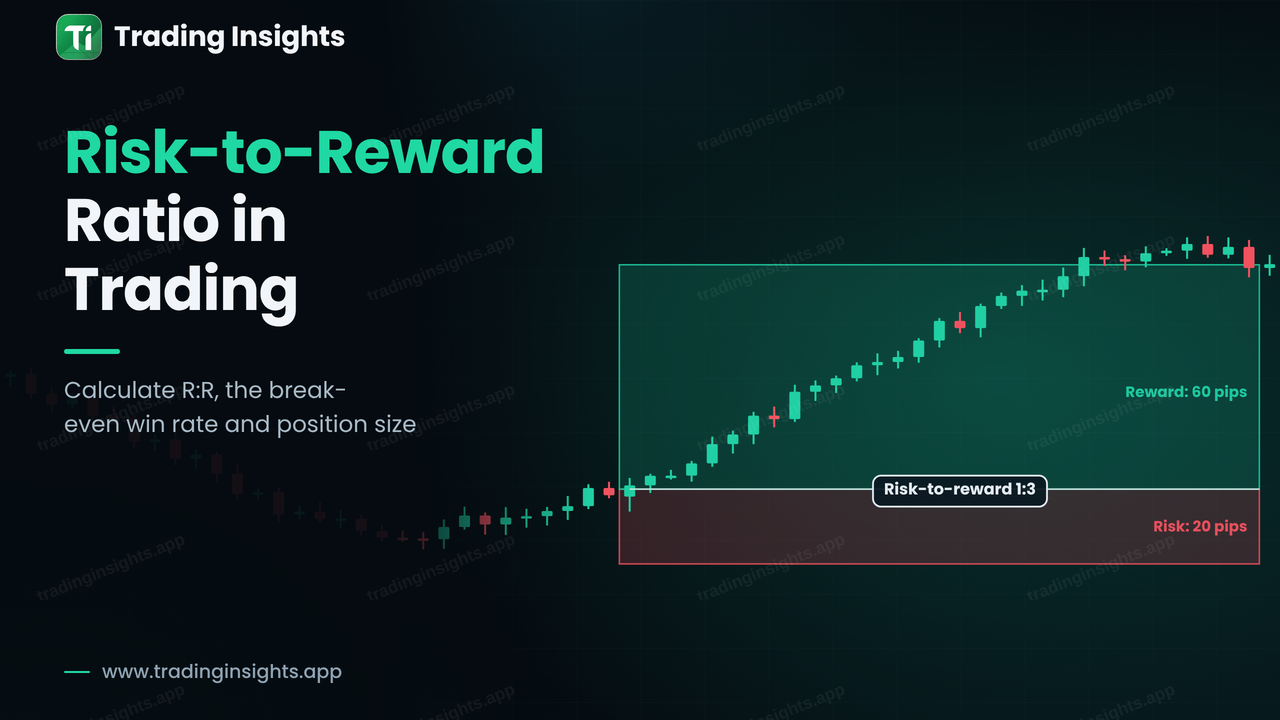
The risk-to-reward ratio compares how much you risk on a trade with how much you aim to gain. If you risk 25 pips to make 50 pips, the ratio is 1:2. It is one of the few numbers you can decide before you enter, and it has a direct effect on how often you need to win to make money. This guide shows the formula, the win rate you need at each ratio, how expectancy combines the two, and how to convert the ratio into a position size so that every trade risks the same fixed amount.
The risk-to-reward formula
The calculation uses three prices: the entry, the stop loss and the take profit.
Risk = distance from the entry to the stop loss.
Reward = distance from the entry to the take profit.
Ratio = reward divided by risk, written as 1:R, where R is the number you get.
For a long trade at 1.0850 with a stop at 1.0825 and a target at 1.0900, the risk is 25 pips and the reward is 50 pips. 50 divided by 25 is 2, so the ratio is 1:2. The same idea is often expressed in R. One R is the amount you risk, so a trade that hits its target is +2R and a trade that hits its stop is -1R.
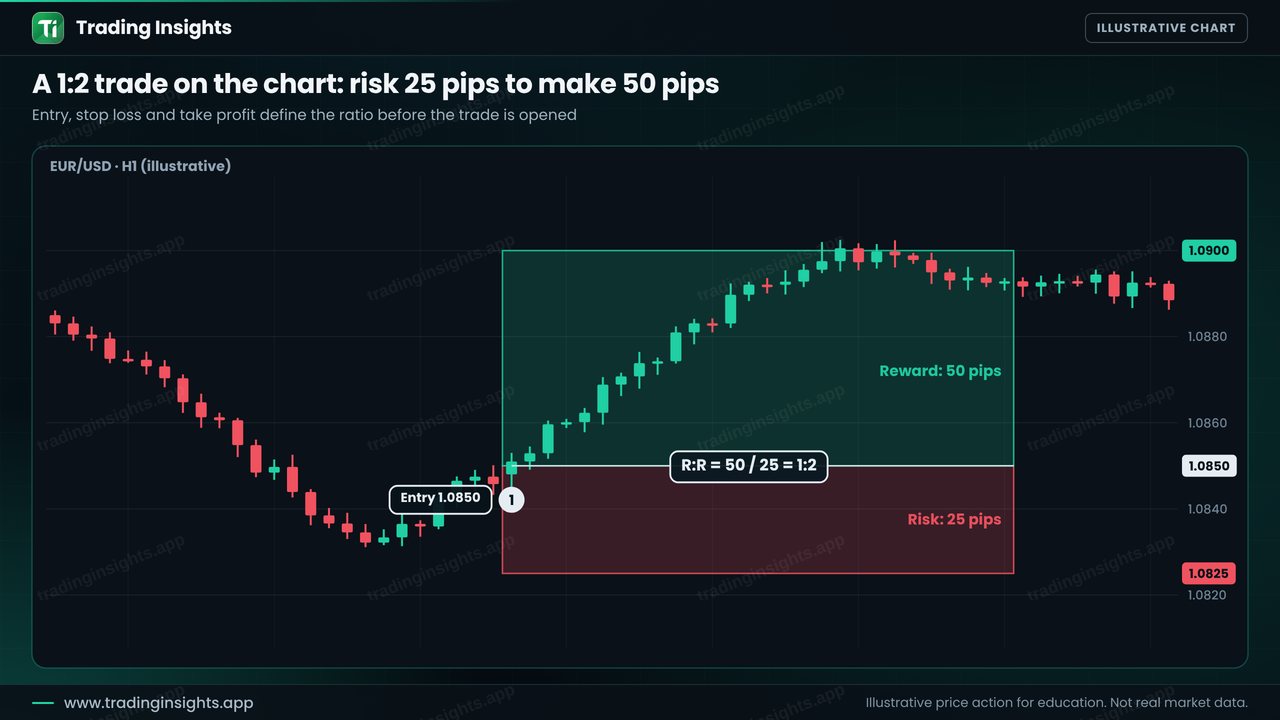
Figure 1: A 1:2 trade. Risk 25 pips to make 50 pips. The ratio is fixed before the order is placed.
Where do these prices come from? From the chart: the stop goes beyond the level that proves your idea wrong and the target sits at the next area where price is likely to react. See how to find entry, stop loss and take profit. The ratio is a result of the chart, and you should not pull the target closer or the stop tighter just to make the ratio look better.
Why the ratio matters: the break-even win rate
A trade with a higher reward needs fewer wins to be profitable. The break-even win rate (before costs) is:
Break-even win rate = 1 / (1 + R)
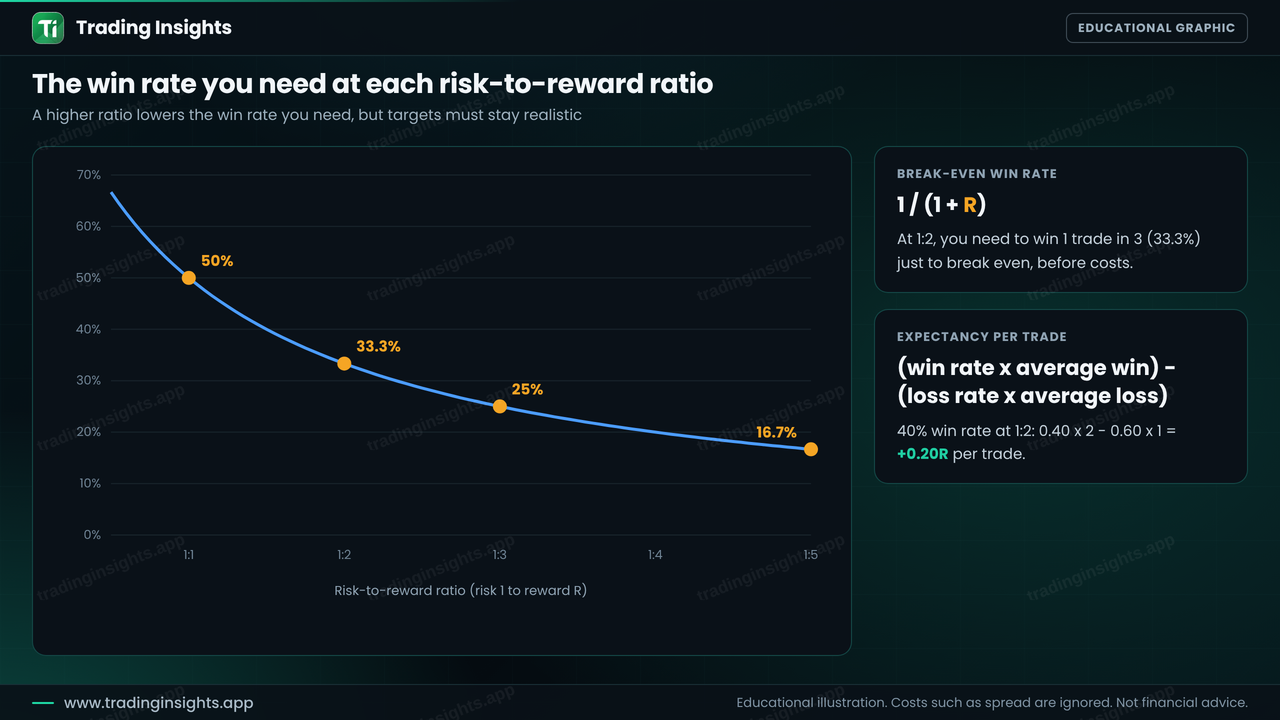
Figure 2: The win rate needed to break even at each risk-to-reward ratio.
Ratio | Calculation | Break-even win rate |
|---|---|---|
1:1 | 1 / (1 + 1) | 50% |
1:2 | 1 / (1 + 2) | 33.3% |
1:3 | 1 / (1 + 3) | 25% |
1:5 | 1 / (1 + 5) | 16.7% |
At 1:2 you need to win only one trade in three just to break even. This is why many traders look for a minimum of about 1:2. But there is a catch: a higher ratio usually means a more distant target, and a more distant target is hit less often. The ratio and the win rate pull in opposite directions, and the real question is which combination your strategy actually delivers. You find this by testing, as described in how to backtest a forex trading strategy.
Expectancy: putting win rate and ratio together
Expectancy tells you how much you earn on average per trade, measured in R:
Expectancy = (win rate x average win) - (loss rate x average loss)
Suppose you win 40% of trades at a 1:2 ratio. The expectancy is 0.40 x 2 - 0.60 x 1 = 0.80 - 0.60 = +0.20R per trade. Over 100 trades that is +20R. If you risk $100 per trade, it is about $2,000 before costs. Now compare a 1:1 ratio at the same 40% win rate: 0.40 x 1 - 0.60 x 1 = -0.20R. The same accuracy, but a losing strategy. The ratio is what turned it around. Remember that spread and commission lower the expectancy, so a thin edge can disappear once costs are included.