Equal highs and equal lows are two or more swing points that stop at almost the same price. Traders see them as liquidity because the repeated level is obvious, so stop-loss and breakout orders tend to build up just beyond it. Learning to mark them correctly helps you anticipate where a sweep might happen and how to judge what follows.
What are equal highs?
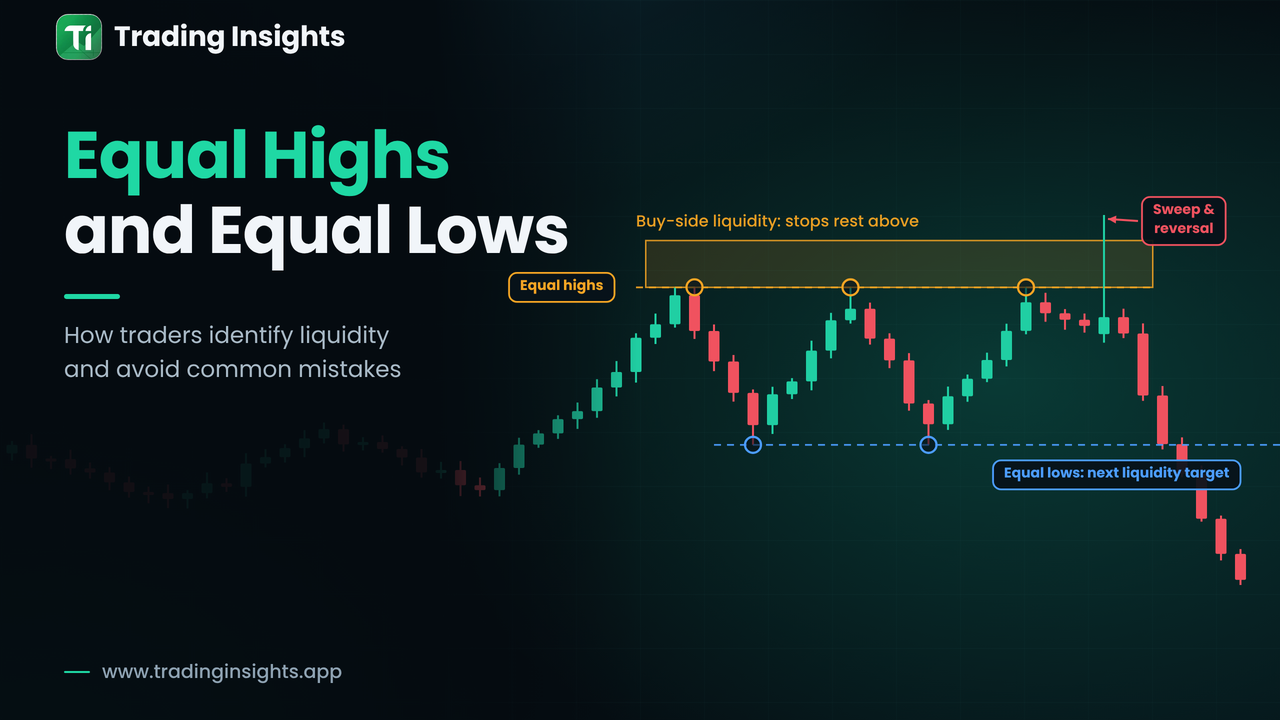
Equal highs form when price rises to roughly the same level at least twice and is rejected each time. The tops do not need to match to the last pip. They only need to be close enough that most traders would draw one horizontal line through them. Equal lows are the same pattern at the bottom: repeated swing lows at nearly the same price.
Why traders treat them as liquidity
A level that has been tested and held several times looks reliable, so traders lean on it. Short sellers place stop-losses just above equal highs, and breakout traders place buy stops there. The result is a dense stack of buy orders above the level. Below equal lows, the same thing happens with sell orders. This is the same mechanism described in what a liquidity pool is, and equal levels are among its clearest examples.
In the chart below, three tops form inside a thin tolerance band. The shaded area above is where buy-side orders are expected to cluster.
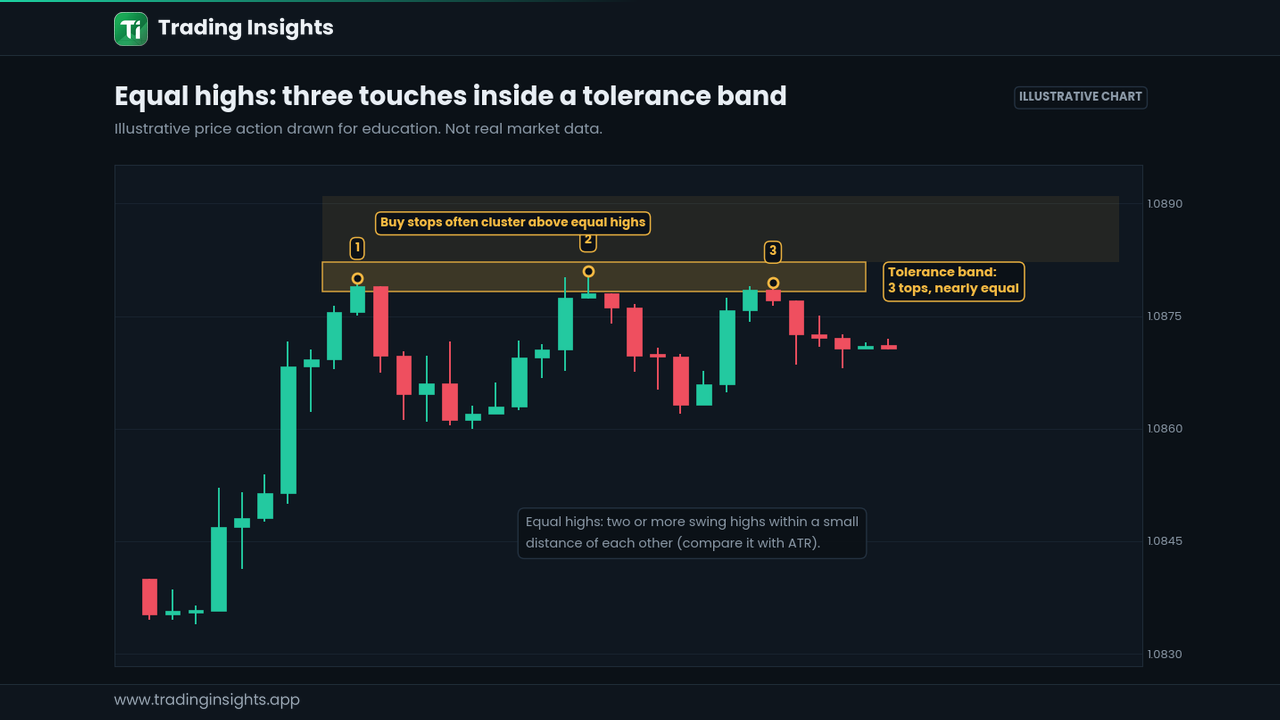
Figure 1: Three tops inside a tolerance band. The zone above them is where stops often rest.
How to identify equal highs and lows
Find clear swings. Use the same swing definition throughout (see market structure basics).
Compare their prices. Measure the difference between the swing points against the average true range (ATR). A common starting point is a gap of well under a quarter of ATR, but this is a guideline you should test, not a fixed rule.
Check the rejection. Each touch should show a visible reaction, such as a sharp wick or a clear move away.
Look at the spacing. Touches that are separated by several candles are cleaner than adjacent candles that simply share a high.
Confirm on a higher timeframe. Equal levels that also appear on H4 or Daily usually matter more than those visible only on M5.
What makes a pool stronger
More touches. Three tops are usually more obvious than two.
Higher timeframe visibility.
Clean, sharp reactions at each touch.
Location at the edge of a range or at a prior day or week extreme.
Sweep or breakout? What happens next
When price reaches equal highs or lows, there are two main outcomes. In a sweep, price spikes beyond the level, triggers the stops and then closes back inside, often followed by a move in the other direction. In a breakout, price closes beyond the level, holds there and builds new structure. The example below shows a sweep of equal lows: the wick drops under the repeated lows, the candle closes back above them, and price rebounds.
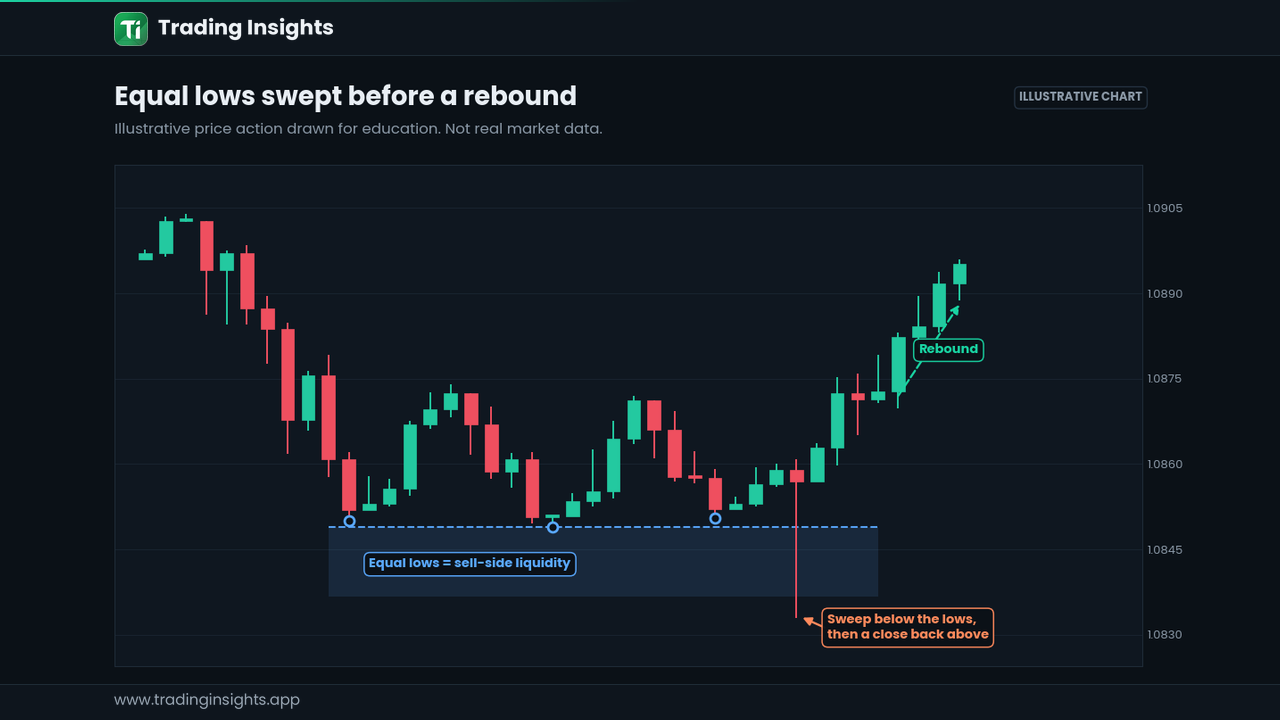
Figure 2: Equal lows swept by a long wick, then a close back above and a rebound.
Clue | Points toward a sweep | Points toward a breakout |
|---|---|---|
Candle close | Back inside the old range | Beyond the level and holding |
Wick size | Long wick, small body | Large body, small wick |
Follow-through | Quick move the other way | Continuation, often with a retest |
Structure after | Shift against the break | Break confirmed in its direction |
Not every sweep is an equal-level event. A minor pullback low that gets taken is a different concept, covered in inducement vs liquidity sweep.
Using equal highs and lows inside a bigger picture
Equal levels at the edge of a range are a form of external liquidity, while those inside a range are internal. If you are building that map, read internal vs external range liquidity next. Equal highs in an uptrend can also simply mark where buyers will be tested before the trend continues, so context always comes first.
A planning example
Say price has formed three equal highs on H1 and trades back down. You might mark the band, note the current ATR and decide in advance that you will only consider a short idea if price sweeps above the band, closes back below it and then breaks the last minor low. If instead price closes above the band and holds on a retest, the sweep idea is off the table and the breakout idea takes over. Writing both branches down before the move keeps you from reacting emotionally to the first wick.
Common mistakes
Forcing two highs to look equal when the gap is large compared with ATR.
Treating every equal level as a guaranteed sweep. Price can leave a level untouched for a long time.
Entering on the sweep wick without any confirmation.
Ignoring the higher-timeframe trend, which can turn a "sweep reversal" into a shallow pullback.
Frequently asked questions
How equal do highs need to be?
There is no official number. Most traders accept highs that are close enough to be drawn as one level, usually judged relative to recent volatility.
Are double tops the same as equal highs?
A double top is a classic pattern built on two equal highs, so the two overlap. The liquidity view focuses on the orders resting above the level, not on the pattern's measured target.
Do equal lows always get swept?
No. They are areas of interest, not guarantees. Price may reverse before reaching them or leave them behind for a long time.
This article is for education only and is not financial advice. Trading involves risk, and these patterns can fail.