Backtesting means applying a written set of trading rules to past price data and recording what would have happened. It cannot predict the future, but it can tell you whether your rules were clear, whether they had an edge in past conditions and how painful the losing streaks were. Skipping it means your first test is with real money. This guide gives you a 7-step process, a trade log format, and the statistics to read at the end. All numbers in the examples are hypothetical samples, created to show how the maths works.
What backtesting can and cannot tell you
A good backtest answers questions such as: how often did the strategy win, how big were the average win and loss, how deep was the worst drawdown, and how long was the longest losing streak? It also tests whether your rules are precise enough to repeat. If you cannot decide what counts as a valid setup without looking at the outcome, the rules are not ready.
It cannot guarantee future results. Markets change, and a strategy that fits one period may fail in another. It also cannot capture real-life issues such as slippage, wider spreads during news and your own emotions. This is why the last two steps of the process are a stress test and a forward test.
The 7-step backtesting process
The diagram below shows the whole process in order. Each step produces something you carry into the next, from a written rule sheet to live results on a demo account.
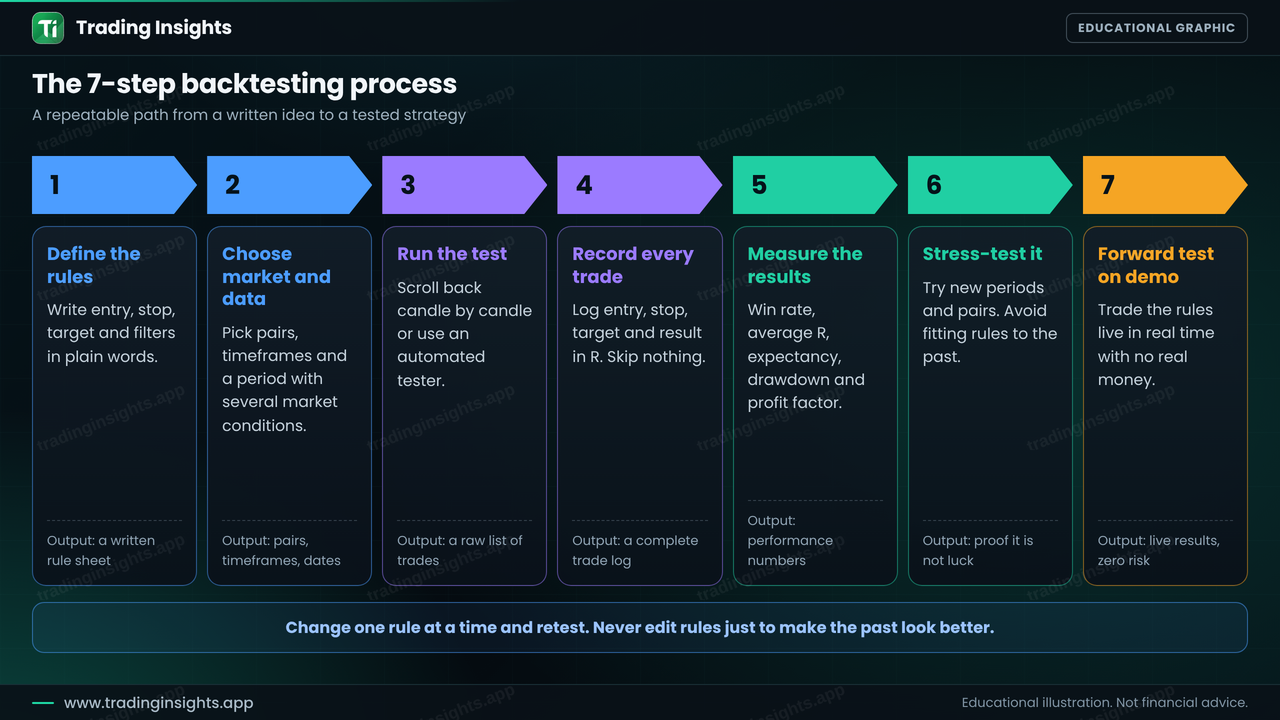
Figure 1: The 7-step process, from a written rule sheet to a demo forward test.
Step 1: Define the rules in plain words
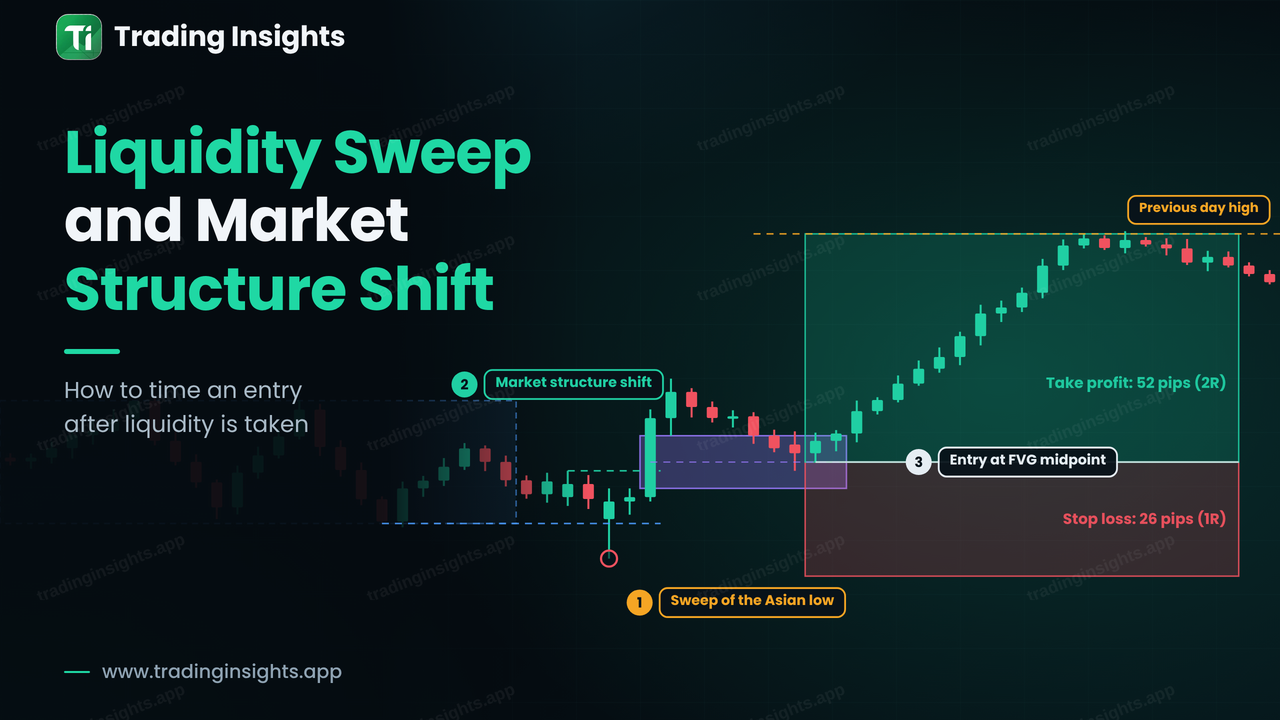
Write down exactly when you enter, where the stop goes, where the target goes and when you do not trade. For example: "Buy after a sweep of the Asian low, a market structure shift on M15 and a pullback into the fair value gap. Stop 2 pips below the sweep. Target the previous day high. Minimum ratio 1:2. No trades 30 minutes before high-impact news." If a rule says "when it looks strong", it is not testable yet. You can use setups from the BOS, CHoCH and FVG guide as a starting point.
Step 2: Choose the market and the data
Pick one or two pairs and one timeframe set. Then choose a period that includes several conditions: trends, ranges and volatile weeks. Testing only a smooth trend flatters any strategy. As a starting point, aim for at least 100 trades, because 20 trades can be pure luck.
Step 3: Run the test
You can test manually by scrolling the chart back and revealing one candle at a time, or with an automated tester if the rules are fully mechanical. Manual testing builds chart-reading skill, but you must be honest. Do not look ahead to see if the trade worked before deciding if it qualifies.
Step 4: Record every trade
Log each trade in the same format, including the losers and the setups you skipped for rule reasons. The best way to compare trades of different sizes is to measure the result in R, where 1R is the amount risked. A trade that makes twice the risk is +2R, and a stopped-out trade is -1R. A simple log looks like this:
Figu
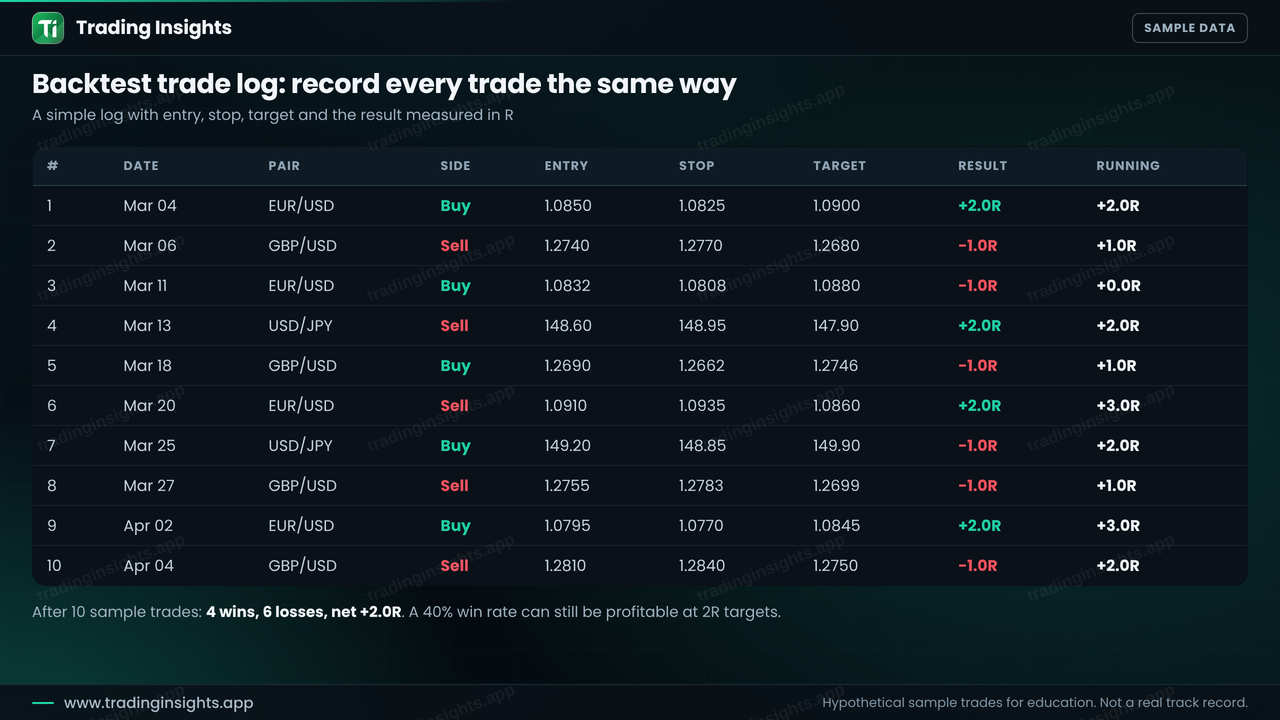
re 2: A sample trade log of 10 hypothetical trades. After 10 trades: 4 wins, 6 losses, net +2.0R.
Notice the point of this sample. Only 4 of 10 trades won, which feels poor, yet the total is +2.0R, because each win made 2R while each loss cost 1R. That is why the risk-to-reward matters as much as the win rate. See how to calculate risk-to-reward ratio.
Step 5: Measure the results
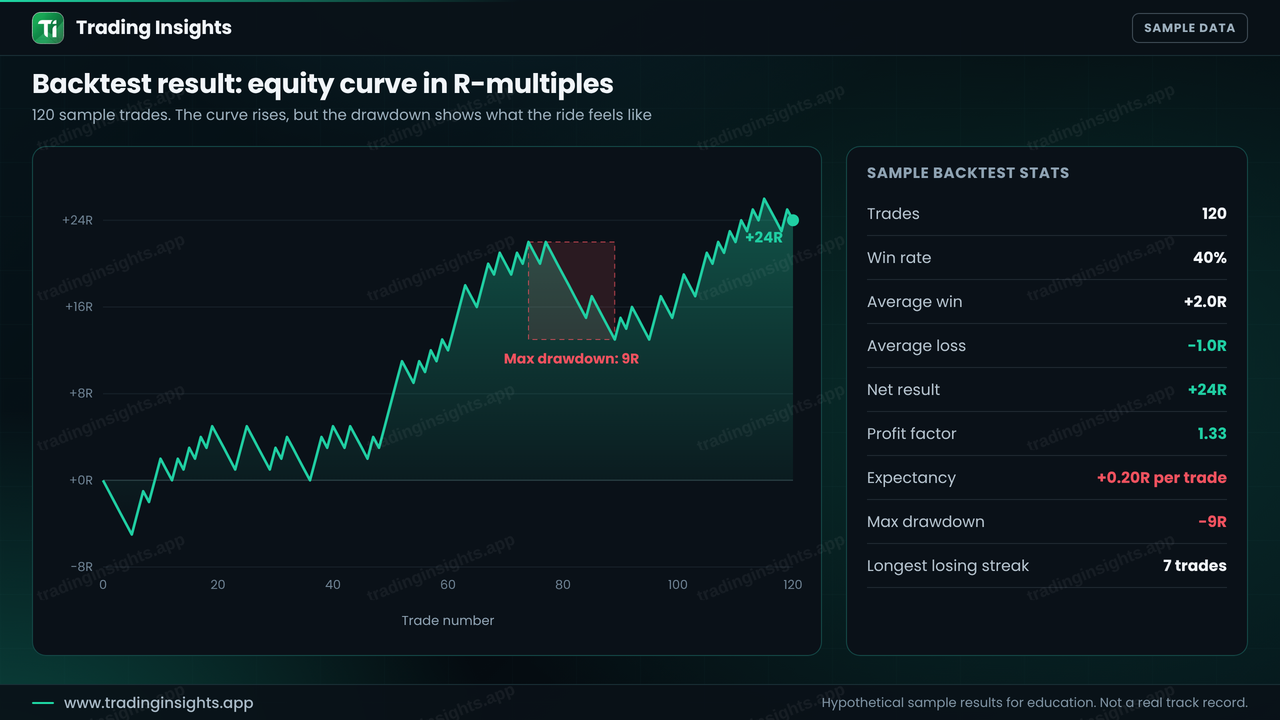
Once you have 100 or more trades, calculate the key statistics:
Win rate: wins divided by total trades.