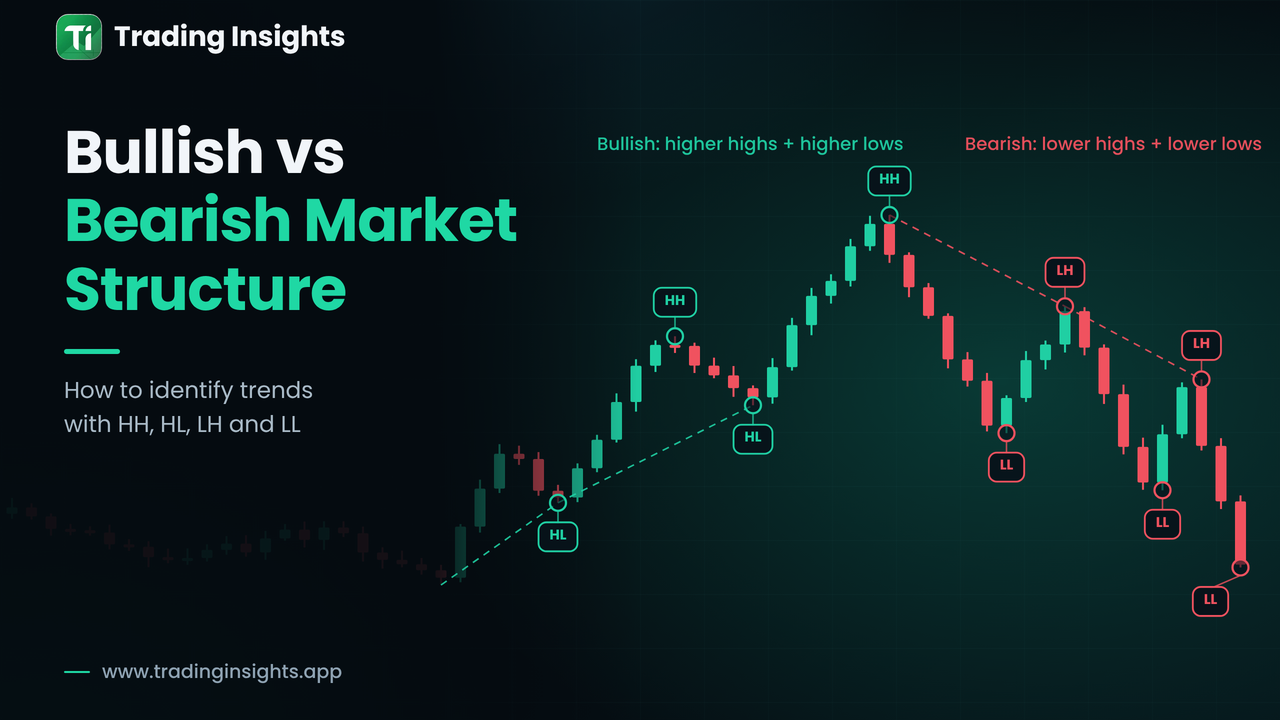
Bullish market structure is a sequence of higher highs (HH) and higher lows (HL). Bearish market structure is a sequence of lower highs (LH) and lower lows (LL). Telling them apart is the quickest way to know which side currently controls the market, and which level would show that control is slipping.
Why direction comes first
Every setup you might look at, whether a pullback entry or a reversal idea, sits inside a larger direction. If you misread that direction, even a well-drawn level can lead you to trade against the dominant flow. Reading structure first gives you a simple filter: in bullish structure you look for buying opportunities or stand aside, and in bearish structure you look for selling opportunities or stand aside. If swing points are still new to you, begin with what market structure is.
Bullish market structure
In a bullish structure, each rally ends above the previous rally and each pullback ends above the previous pullback. Buyers keep stepping in at higher prices. The most recent higher low is the swing protecting the trend: while price stays above it, the sequence is intact. A close below it is the first serious warning.
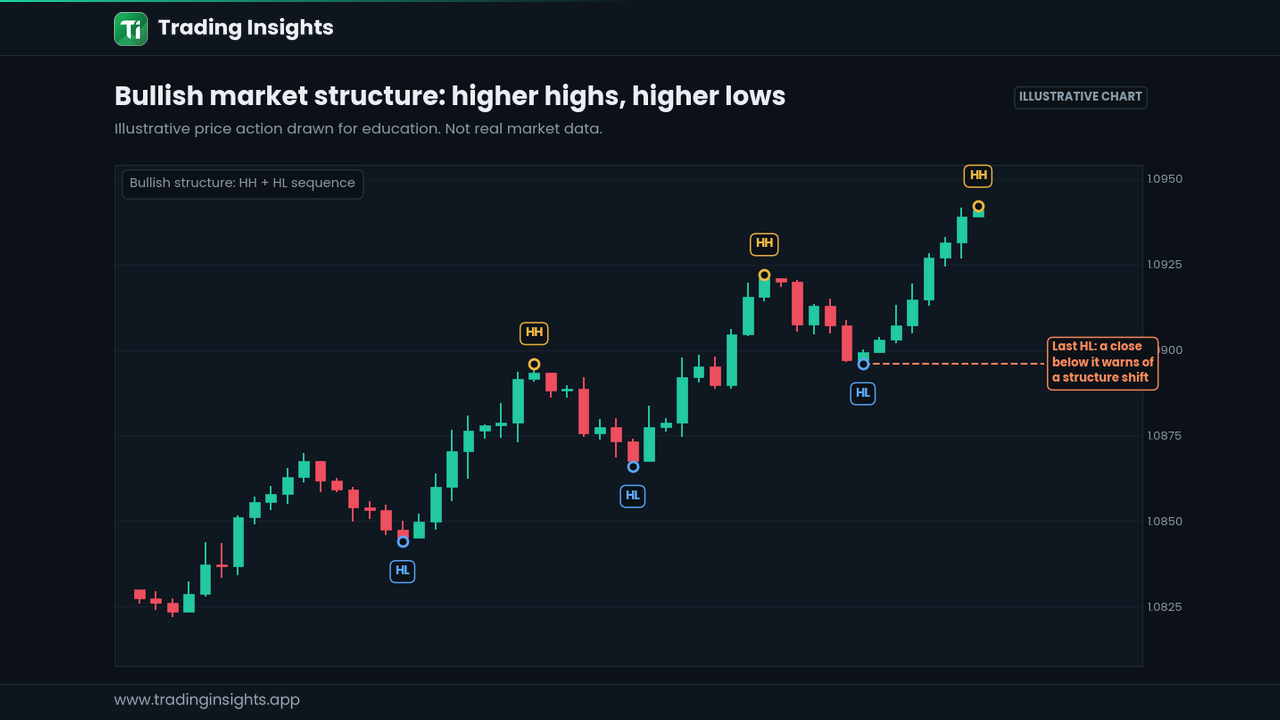
Figure 1: Bullish structure. Each HH and HL is labelled, and the last HL is the level to watch.
Bearish market structure
Bearish structure is the mirror image. Each decline reaches a lower low and each bounce fails at a lower high. Sellers keep pushing in at lower prices. The most recent lower high is the protective swing: while price stays under it, the sequence holds. A close above it is the early warning that sellers are losing control.
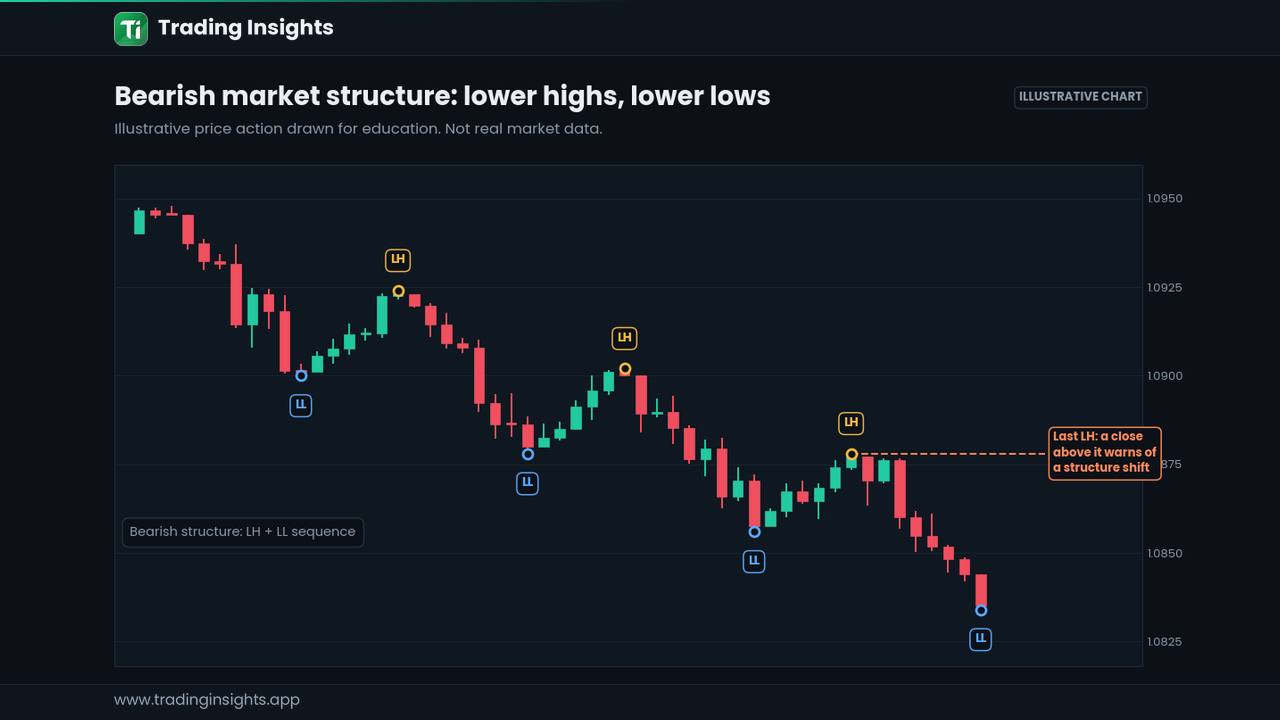
Figure 2: Bearish structure. The last LH is the level that would challenge the downtrend.
Bullish structure | Bearish structure | |
|---|---|---|
Swing sequence | HH and HL | LH and LL |
Who is stronger | Buyers | Sellers |
Protective swing | Last higher low | Last lower high |
Continuation signal | Close above the last high (BOS) | Close below the last low (BOS) |
First warning | Close below the last HL (CHoCH) | Close above the last LH (CHoCH) |
How a bullish structure turns bearish
A reversal is a process, not a candle. A typical sequence has four steps. First, price fails to make a new higher high and prints a lower high instead. Second, price breaks below the last higher low, which is the change of character. Third, price makes a lower low. Fourth, the next bounce stays below the previous high, confirming the new direction. Each step adds evidence, and the earlier you act, the less confirmation you have.
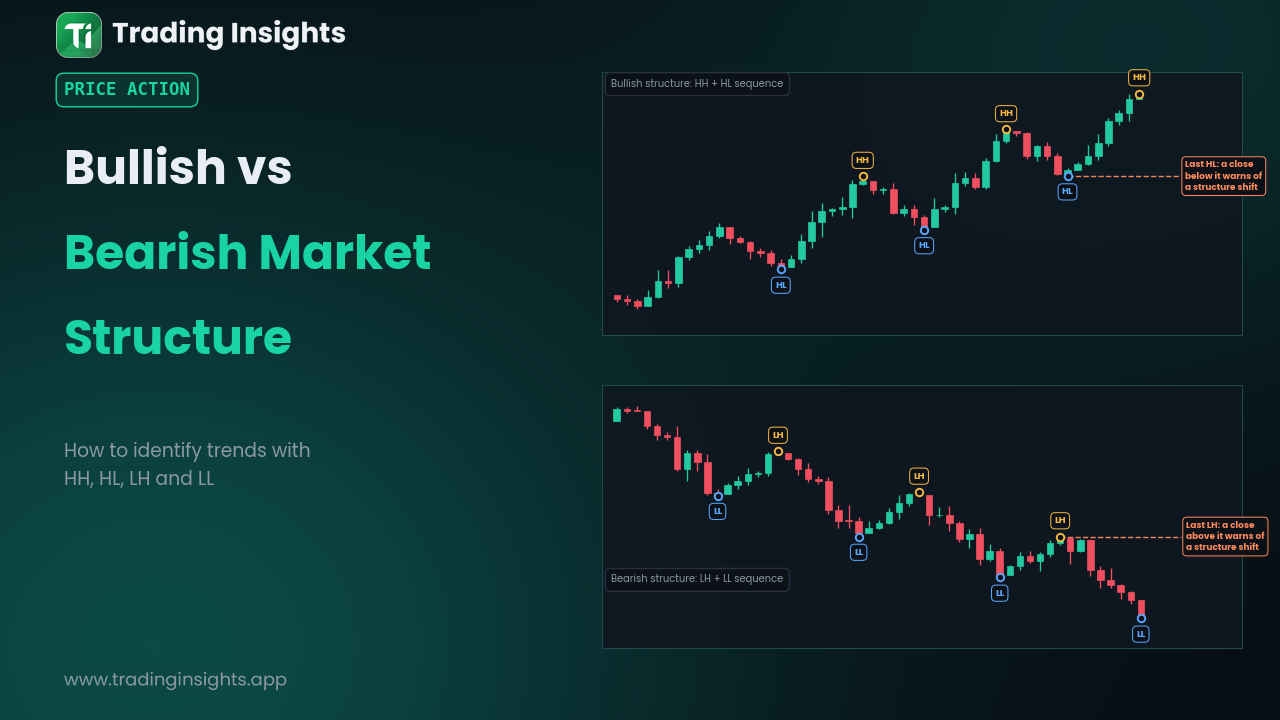
Figure 3: A shift from bullish to bearish structure, from the failed high to the lower low.
The same steps in reverse describe a bearish structure turning bullish. For a closer look at the break labels used here, see our explanation of BOS and CHoCH in the market structure guide.
How to identify the structure on your chart
Zoom out. Start on a timeframe where the last 20 to 40 candles show clear swings.
Mark swings with one consistent rule. For example, a high with two lower highs on each side.
Compare each swing with the previous same-type swing. Label it HH, HL, LH or LL.
Count the evidence. Two or three consecutive HH/HL pairs make a stronger bullish case than one.
Mark the protective swing. Place a horizontal line at the last HL or LH.
Re-check after each close. Structure is updated by closed candles, not by prediction.
Using more than one timeframe
Higher-timeframe structure sets the background, and lower-timeframe structure shows the detail. A bearish CHoCH on M15 inside a clear bullish H4 trend may only be a pullback. When both timeframes agree, the picture is cleaner. When they conflict, many traders simply wait. The quality of the move behind each swing also matters: fast, one-sided candles, as in displacement candles, add weight to a break.
Common mistakes
Using wicks instead of closes to declare a trend change.
Marking swings that are too small, which produces constant false shifts.
Calling a trend from only one HH or one LL.
Forgetting that a quick poke beyond a level can be a trap rather than a real break. See inducement vs liquidity sweep.
Frequently asked questions
How many swings do I need to call a trend?
Many traders want at least two consecutive higher highs and higher lows (or lower highs and lower lows). One pair is a hint; two or more is a pattern.
What if price makes a higher high but not a higher low?
That is a mixed picture, often seen in a widening range. Without both parts of the sequence, "bullish" is not yet justified.
Is a CHoCH a reversal signal?
It is a warning that the old structure is being challenged. Reversal is only likely if later swings also confirm the new direction.
This article is for education only and is not financial advice. Trading carries risk, and structure can change quickly.