Practical, step-by-step strategies and market insight from our trading desk — written to be read, tested on a demo account, then applied with live signals in the app.
 Price Action
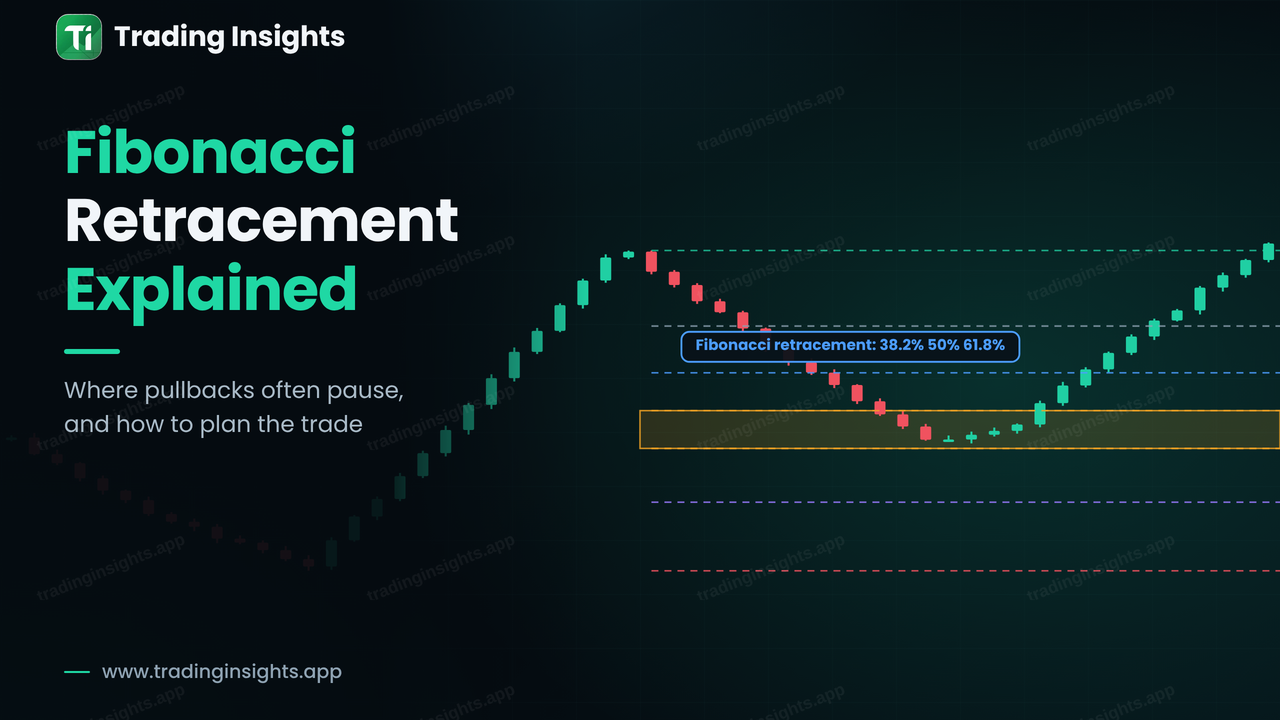
Fibonacci retracement levels show how deep a pullback has gone inside a trend. Learn how to draw them, what the main levels mean and how to plan a pullback trade with a defined stop and target.
Read more →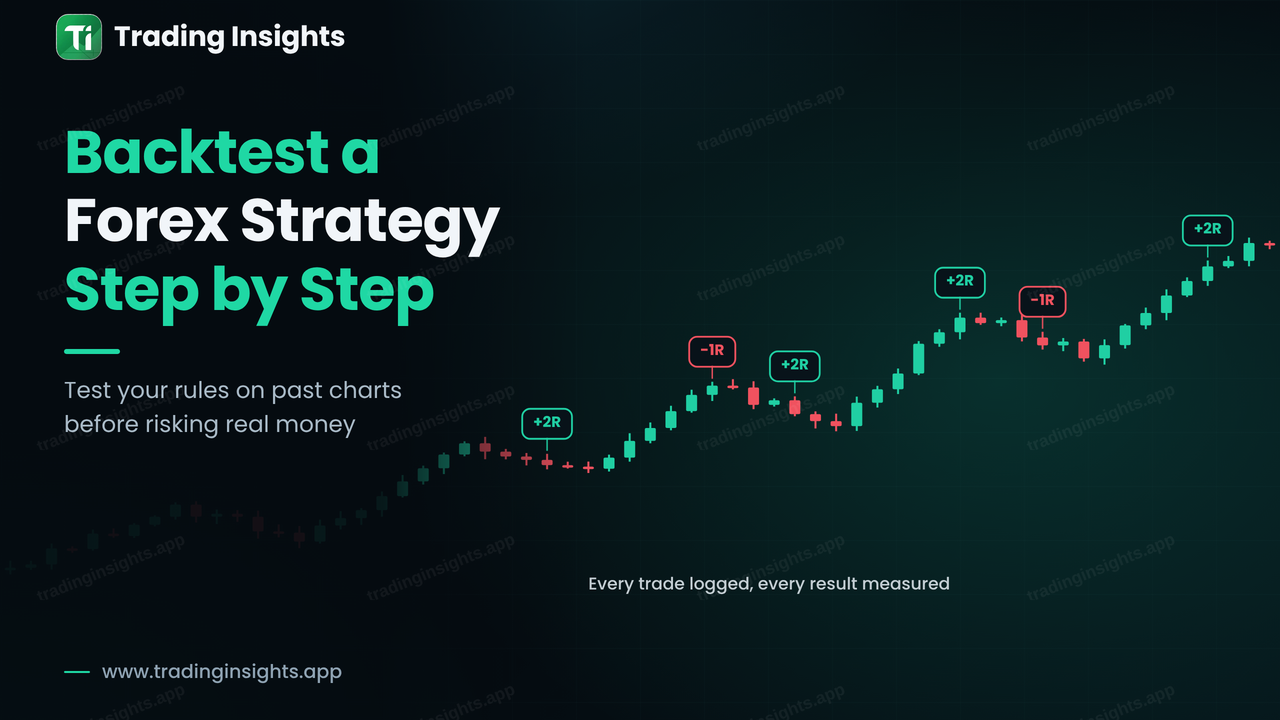 Trading Strategy
Backtesting shows whether your rules had an edge on past charts before you risk money. Follow the 7 steps, learn to log trades in R and read expectancy, profit factor and drawdown.
Read more →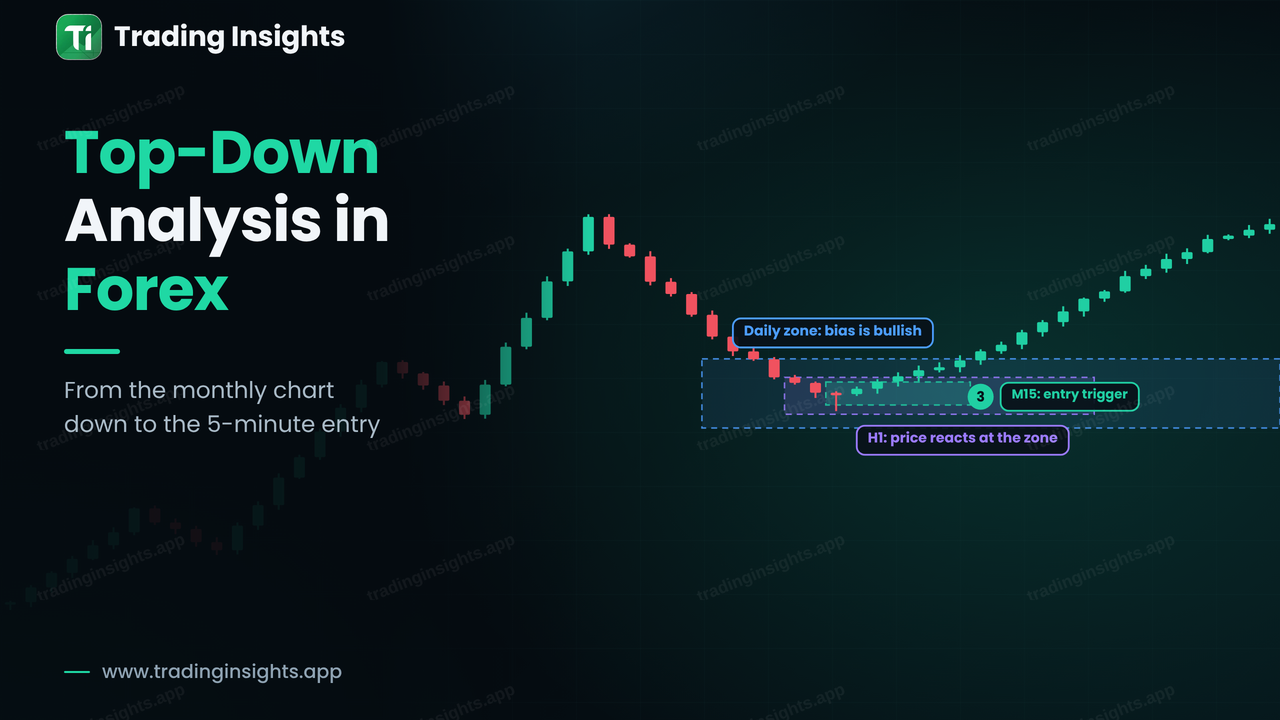 Price Action
Top-down analysis moves from the big picture to the entry in order. Learn what each timeframe is for, how many you really need, and how to follow one idea from Daily to M15.
Read more →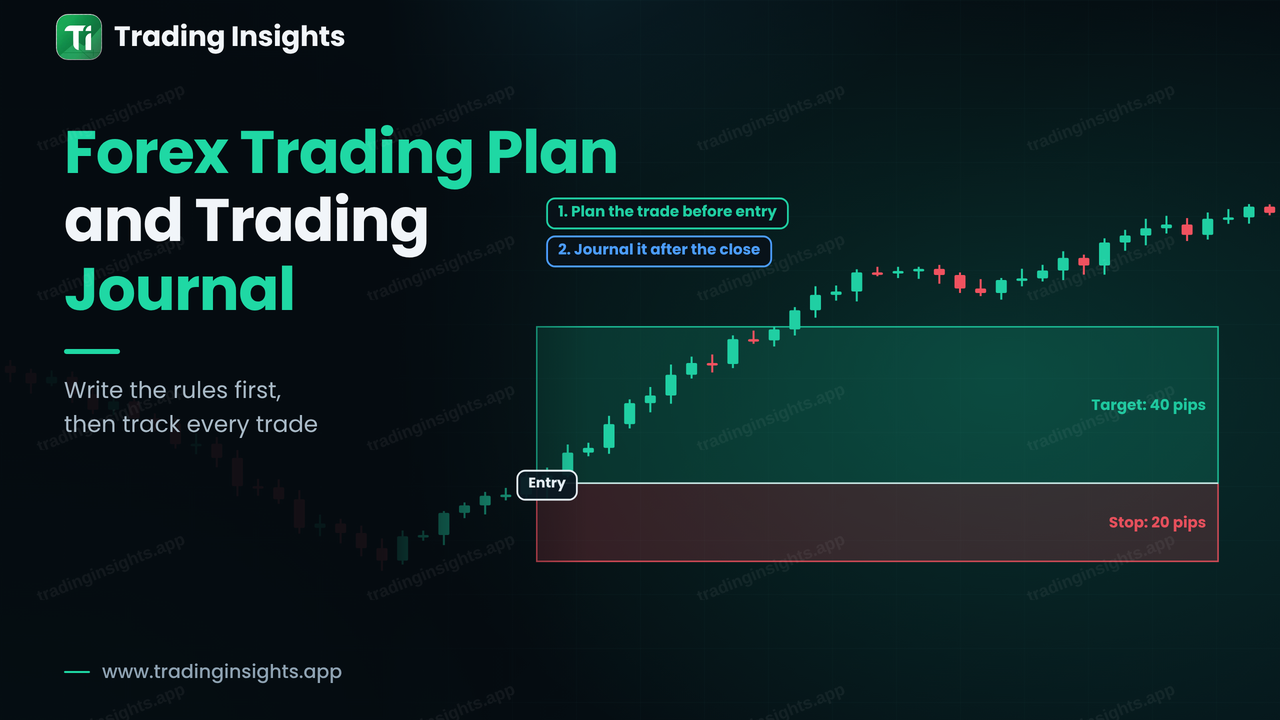 Trading Strategy
A trading plan fixes your rules before the trade, and a journal checks whether you followed them. Get a sample eight-part plan, a journal entry example and a weekly review method.
Read more →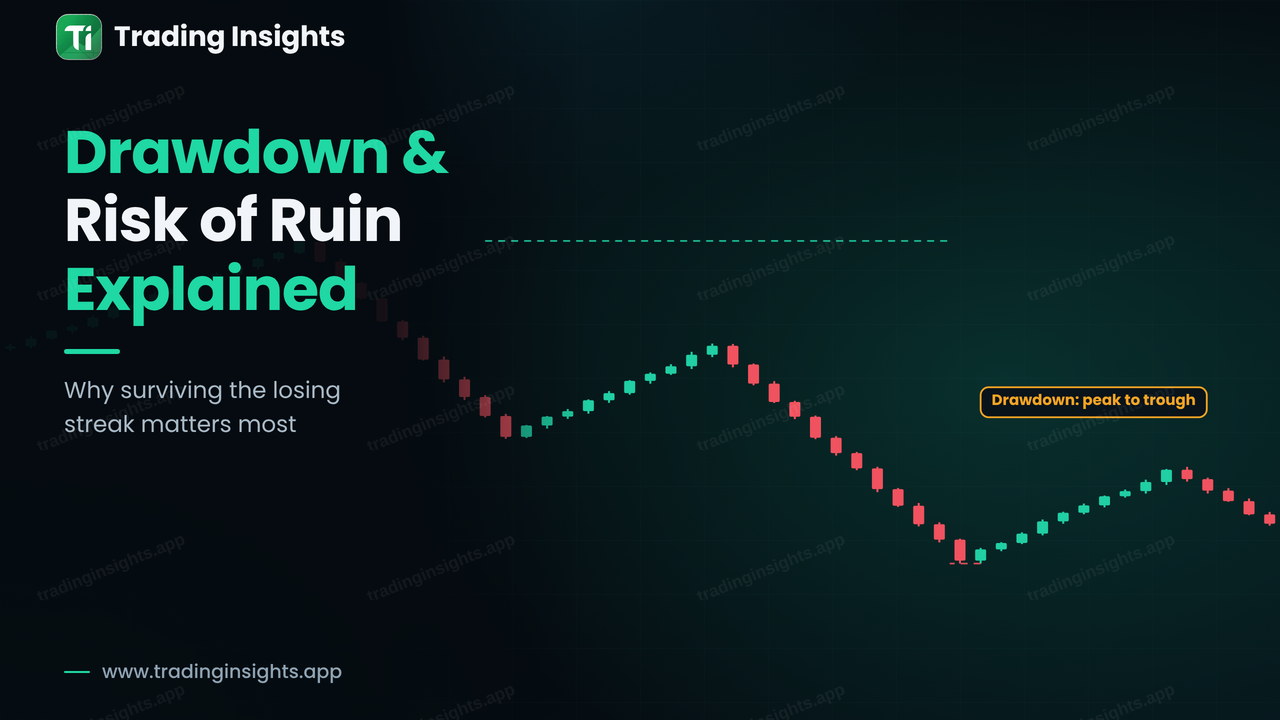 Risk Management
Drawdown is the drop from an account peak to its next low, and risk of ruin is the chance of losing so much that you cannot recover. Learn the maths of recovery and how to protect your account.
Read more →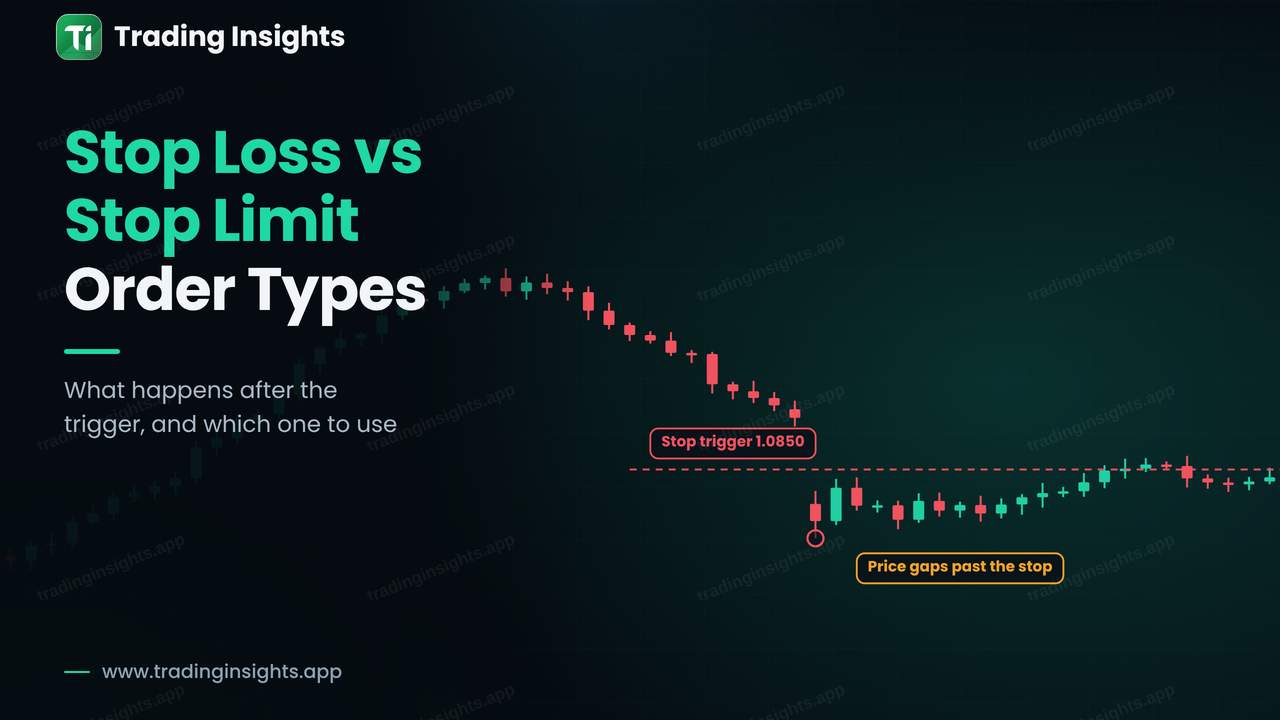 Forex Basics
A stop order guarantees an exit but not the price. A stop-limit controls the price but may not fill. See the difference on a chart with real numbers, and learn the four pending orders.
Read more →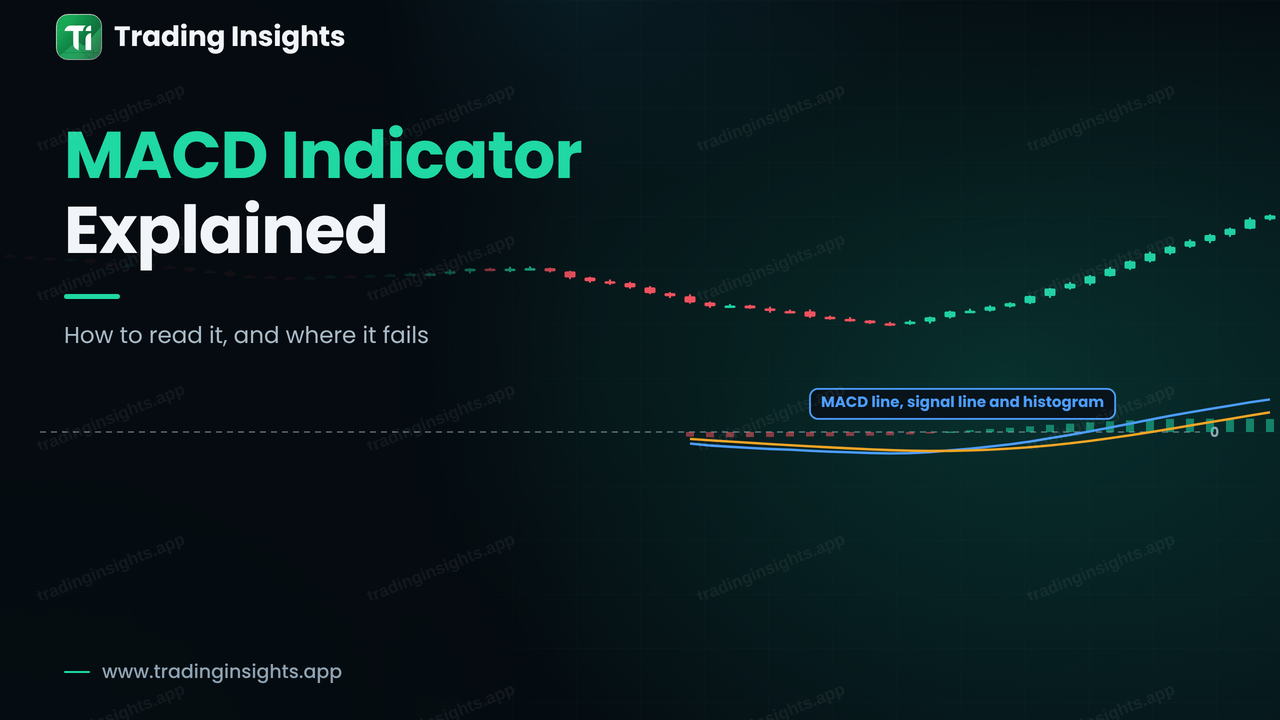 Forex Basics
The MACD shows the momentum of a trend using two moving averages. Learn the 12, 26, 9 settings, how crossovers, the zero line and divergence work, and why the MACD gives false signals in ranges.
Read more →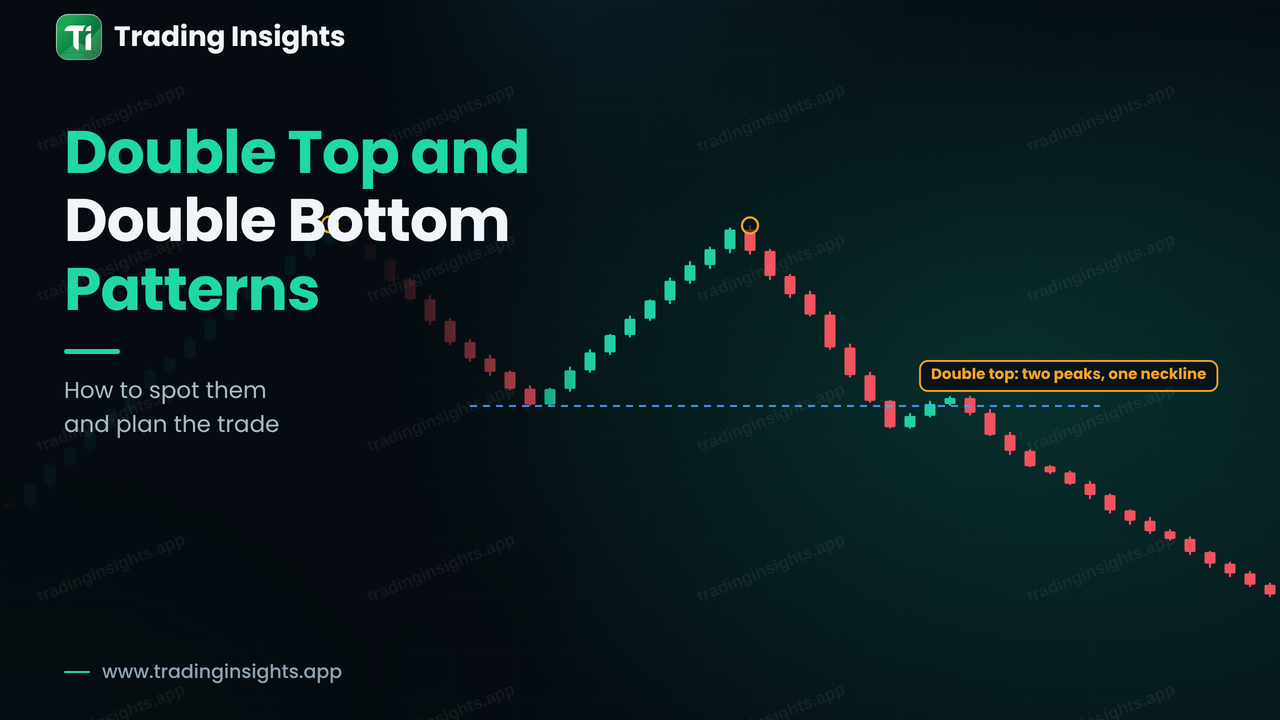 Price Action
A double top warns that an uptrend may be ending, and a double bottom warns that a downtrend may be ending. Learn how to identify each pattern, confirm it with the neckline and plan a trade.
Read more →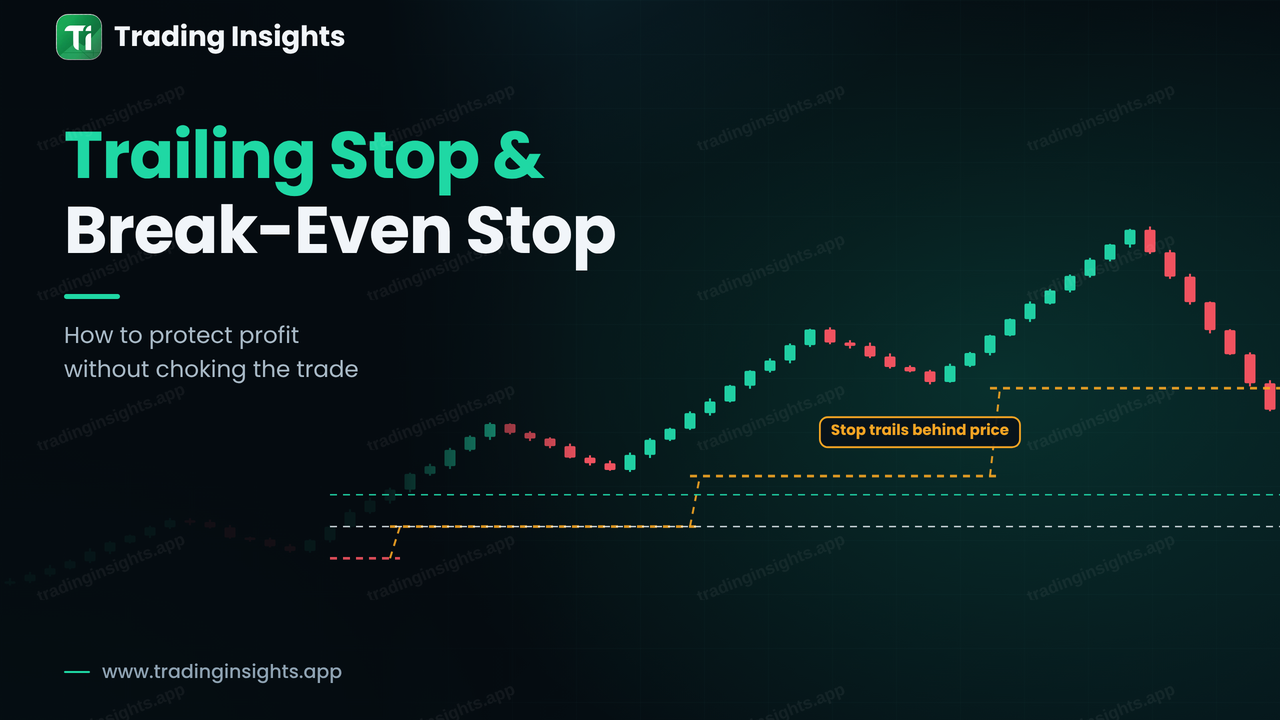 Risk Management
A break-even stop removes the risk of a loss once a trade is in profit, and a trailing stop follows price to lock in gains. Learn how each works, the trade-offs and a step-by-step example.
Read more →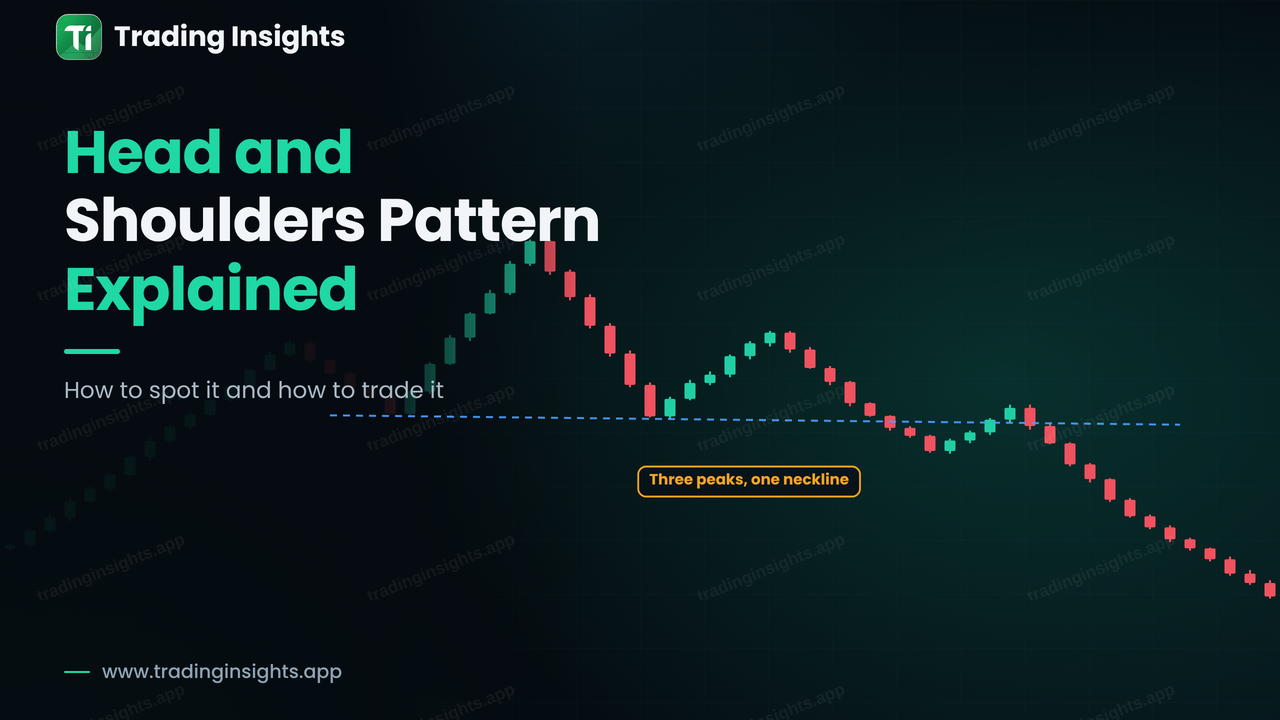 Price Action
The head and shoulders is a classic reversal pattern made of three peaks, with the middle one the highest. Learn how to find the neckline, confirm the break and plan a trade with a stop and a target.
Read more →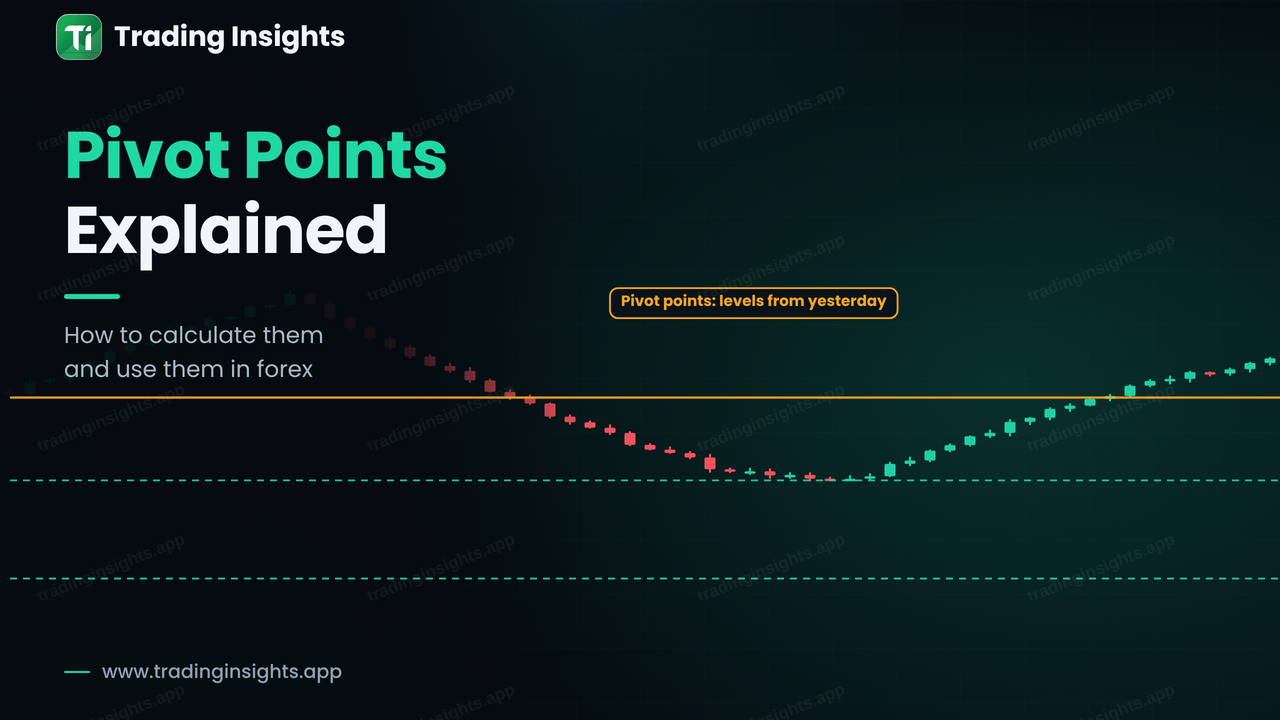 Forex Basics
Pivot points turn yesterday's high, low and close into five levels for today. Learn the formulas with a worked example, how traders read the levels and a pivot bounce trade with a stop and a target.
Read more →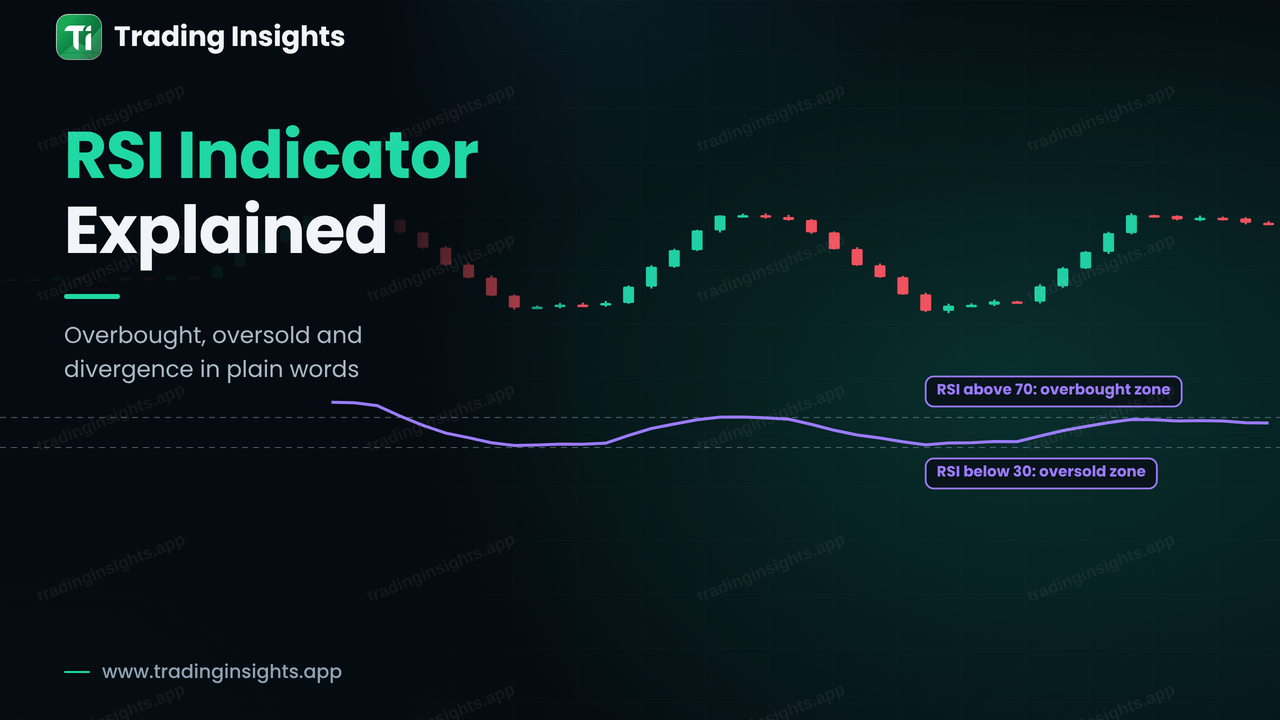 Forex Basics
The RSI measures the speed of recent price moves on a scale from 0 to 100. Learn what overbought and oversold really mean, how to spot divergence and how to avoid the most common RSI mistakes.
Read more →Signals are free on the website. Get the Trading Insights app for instant push alerts, the MT4/MT5 auto-execution EA and a live results dashboard.
