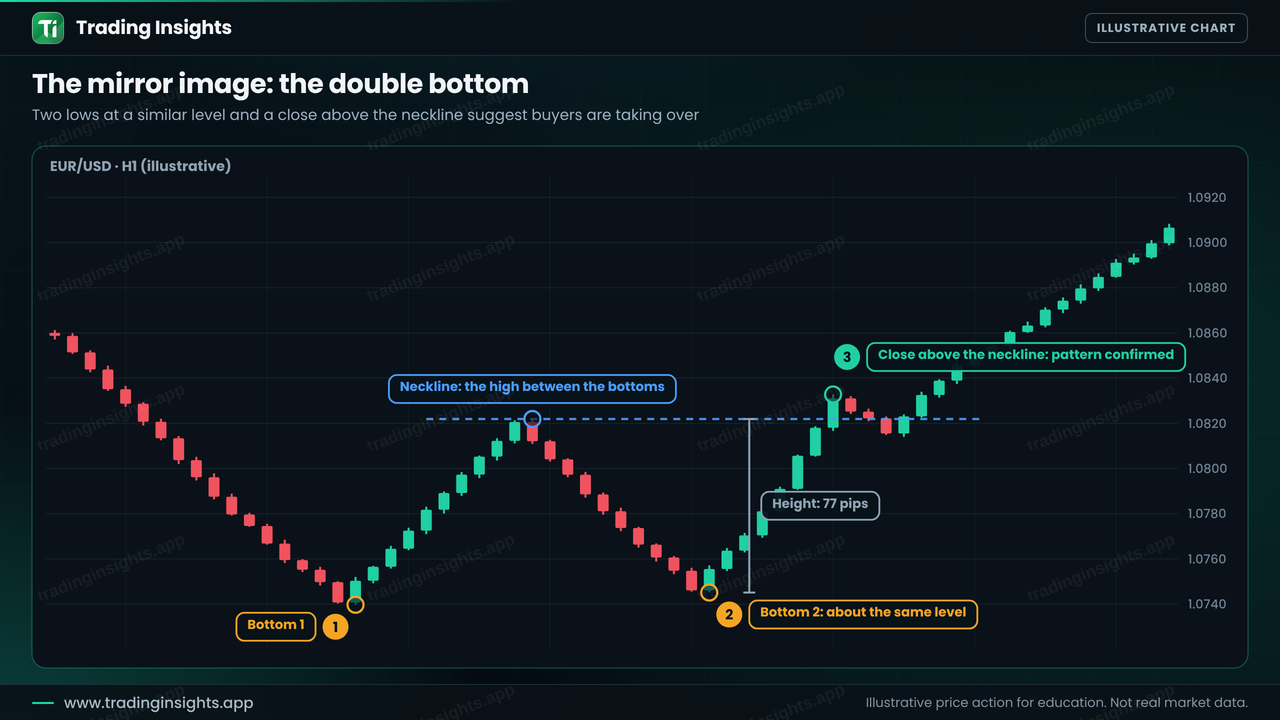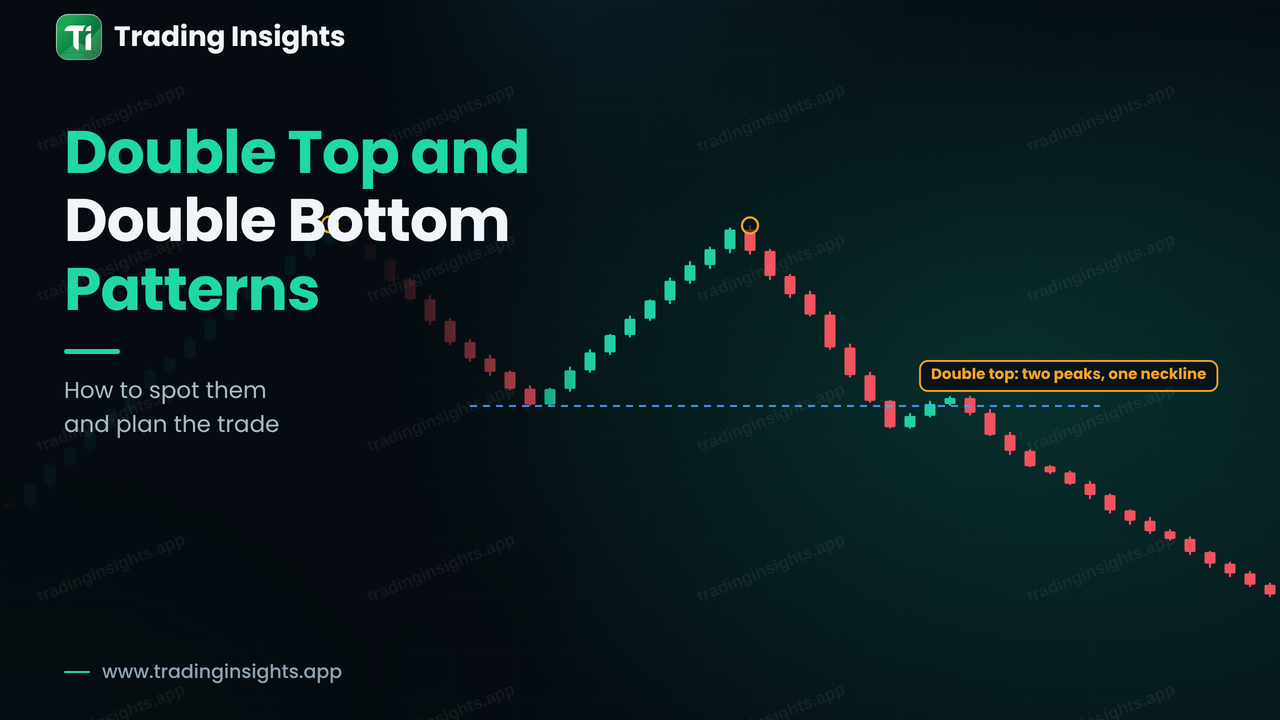
A double top is a reversal pattern in which price rises to a high, pulls back, rises to about the same high again and fails. A double bottom is the mirror image: price falls to a low, bounces, falls to about the same low and holds. Both shapes show that the market tried twice to push through a level and could not, which is why they are among the most popular chart patterns in forex. This guide shows how to identify each pattern, why the neckline decides whether the pattern is real, how to measure a target, and how to plan a trade with a stop and a position size.
The double top: anatomy
A double top forms after an uptrend and has four parts.
- Peak 1: price makes a high and then pulls back.
- The neckline: the low of that pullback. It is the key level of the pattern.
- Peak 2: price rallies back to about the same level as the first peak and fails to break above it.
- The break: price falls and closes below the neckline. Only then is the pattern confirmed.
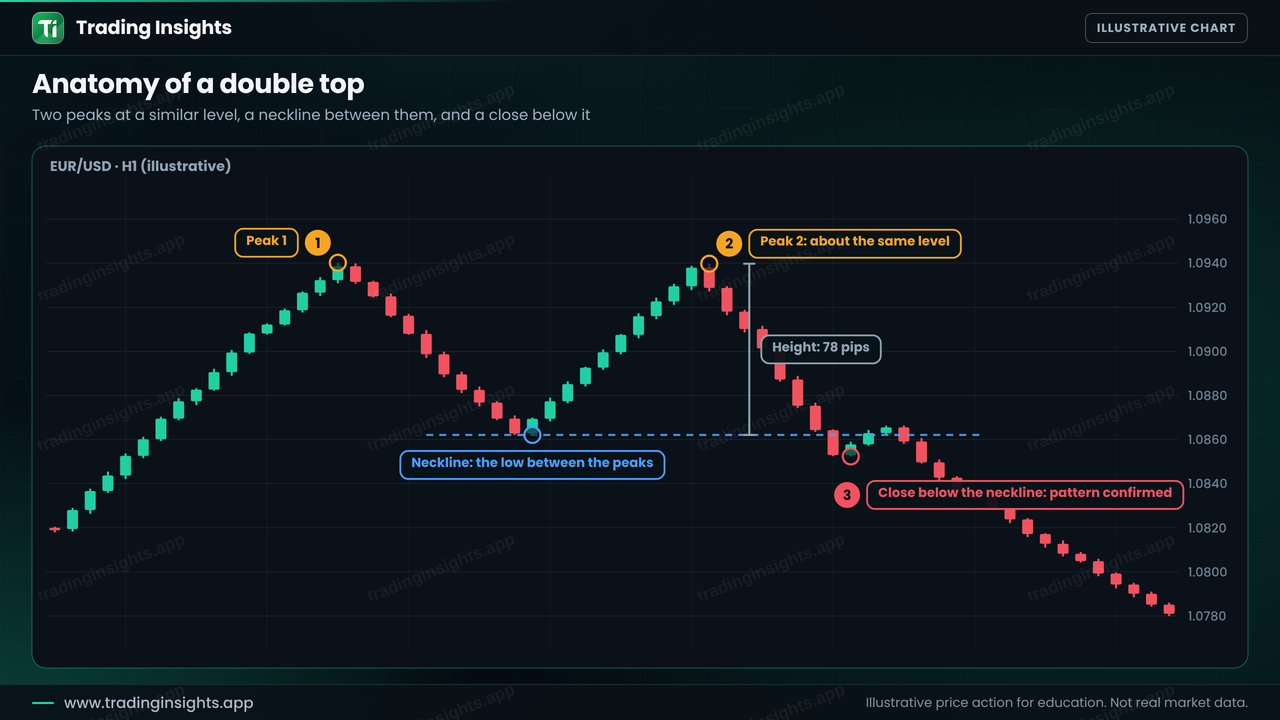
The height of the pattern is the distance from the peaks down to the neckline. In this example it is 78 pips, and traders use it to estimate a target by projecting the same distance down from the neckline. It is an estimate, not a promise, and price may stop short of it or run past it.
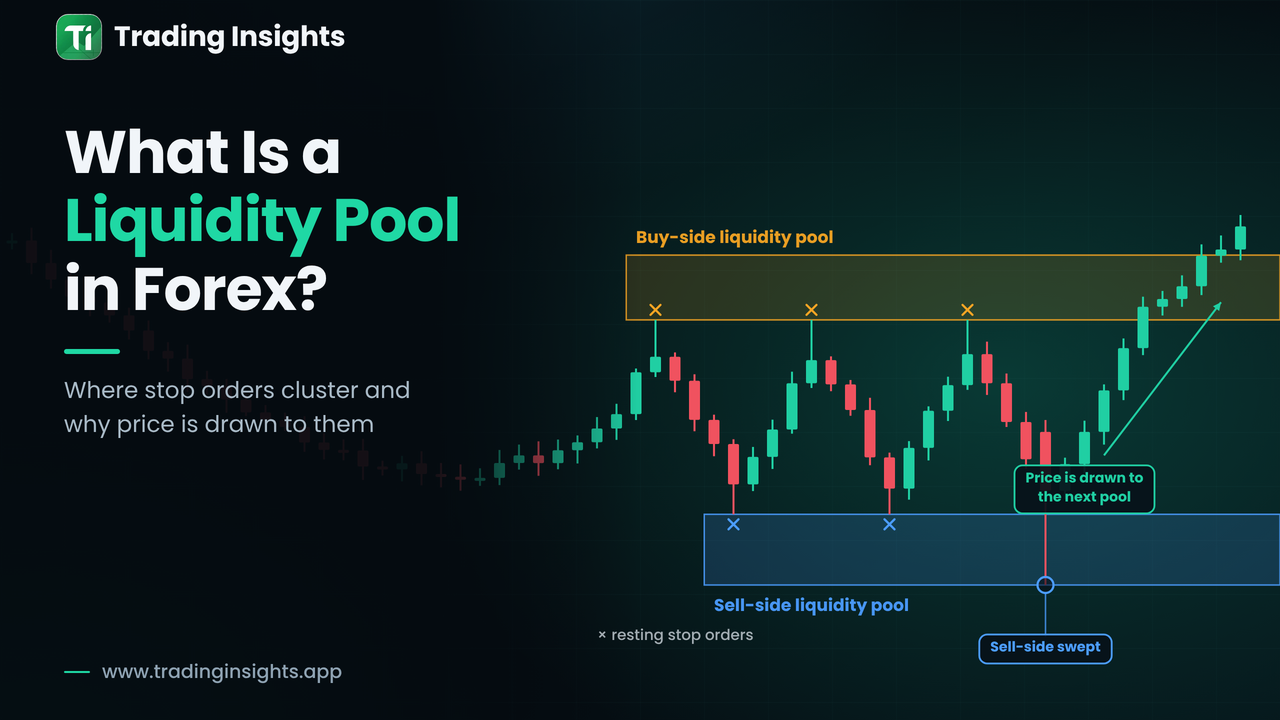
The peaks do not have to be exactly equal. A small difference is normal, and the idea is that the second attempt failed at roughly the same area. The pattern is much stronger when it forms at a meaningful level, such as a higher-timeframe resistance, which you can find using support and resistance. A second peak that sweeps just above the first high before reversing is a form of liquidity grab, explained in equal highs and equal lows.
The neckline break and the retest trade
The most important rule is to wait for the neckline to break, because until then price may simply be moving in a range. After the break, price often comes back to test the neckline from below, which gives a second chance to enter with a tighter stop.
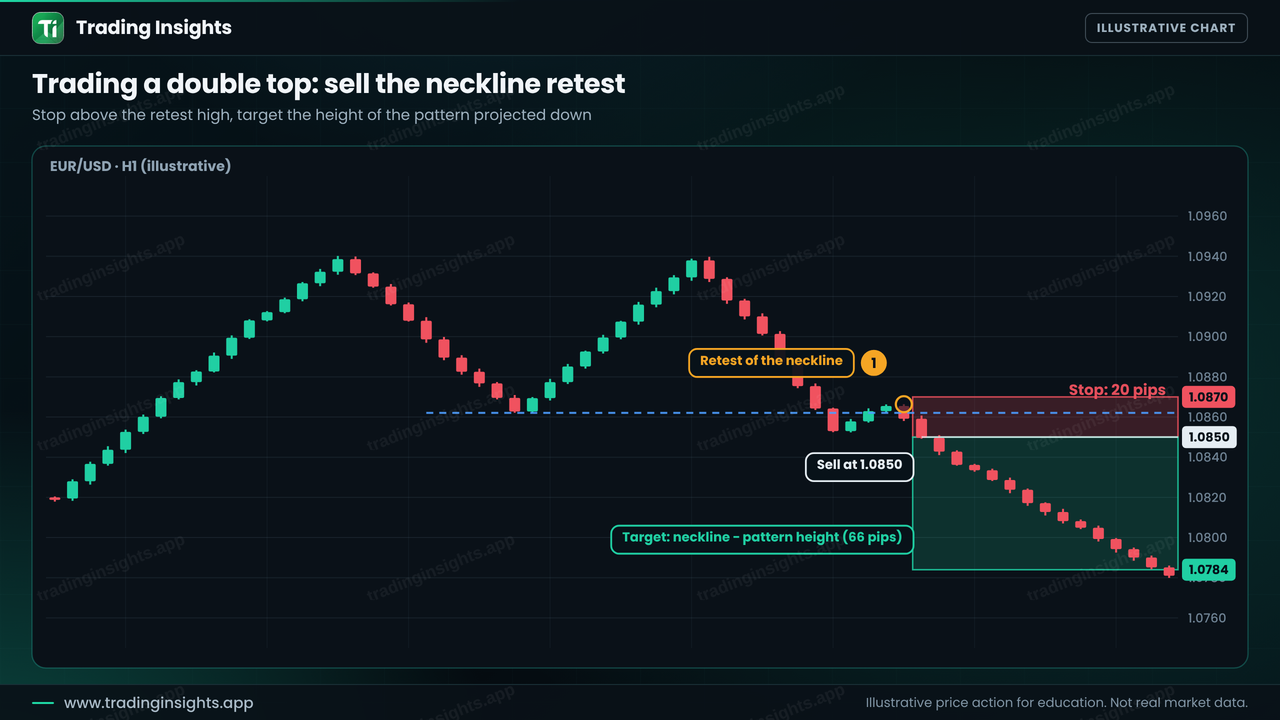
- Entry: 1.0850, after the retest of the neckline fails.
- Stop loss: 1.0870, above the retest high (20 pips).
- Take profit: 1.0784, the neckline minus the pattern height (66 pips from the entry). That is a ratio of about 1:3.3.
With a $10,000 account risking 1% ($100), the position size is $100 / (20 pips x $10 per pip per lot) = 0.50 lot. If price closes back above the neckline, the pattern has failed and the stop closes the trade at a $100 loss. You can run your own numbers with the position size calculator and the risk-reward calculator, and the full method is in how to calculate position size.
Some traders prefer to sell on the first close below the neckline instead of waiting for the retest. That gives a better chance of catching the move, but the stop must be above the second peak, which makes it wider. Price does not always retest, so a plan that waits for a retest will sometimes miss the trade. Neither approach is right for everyone, and you should test your choice, as explained in how to backtest a forex trading strategy.