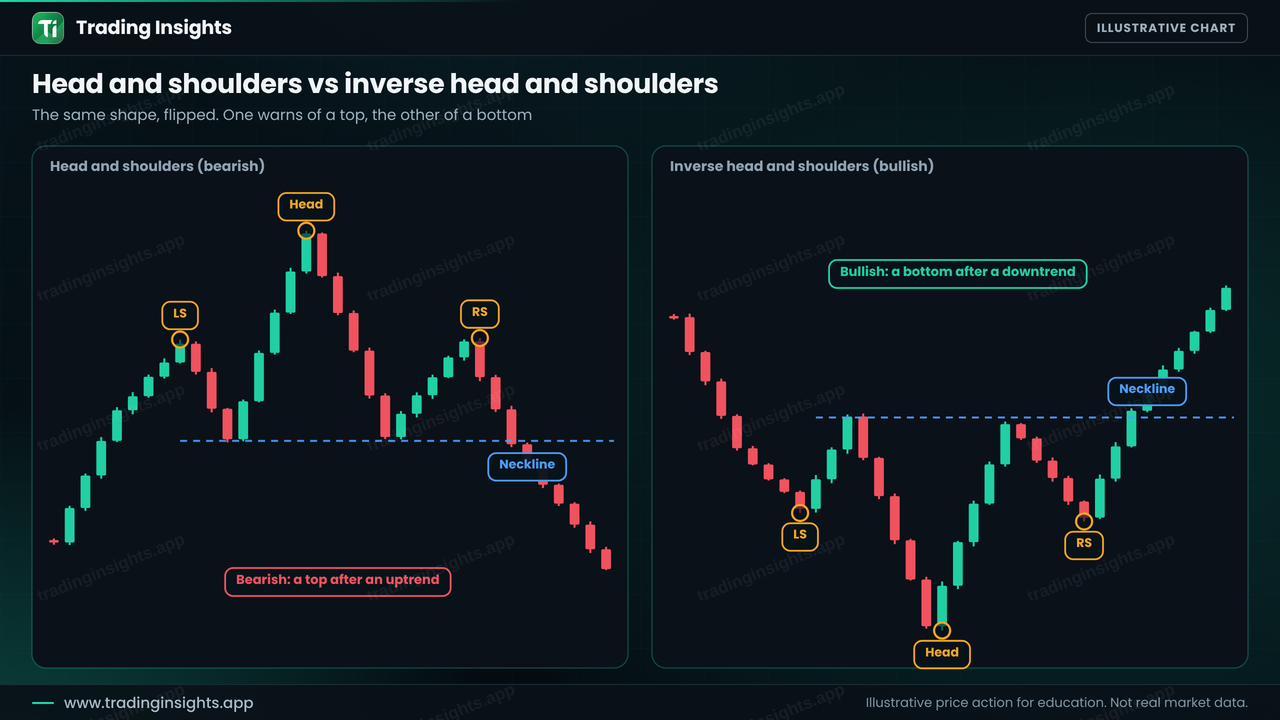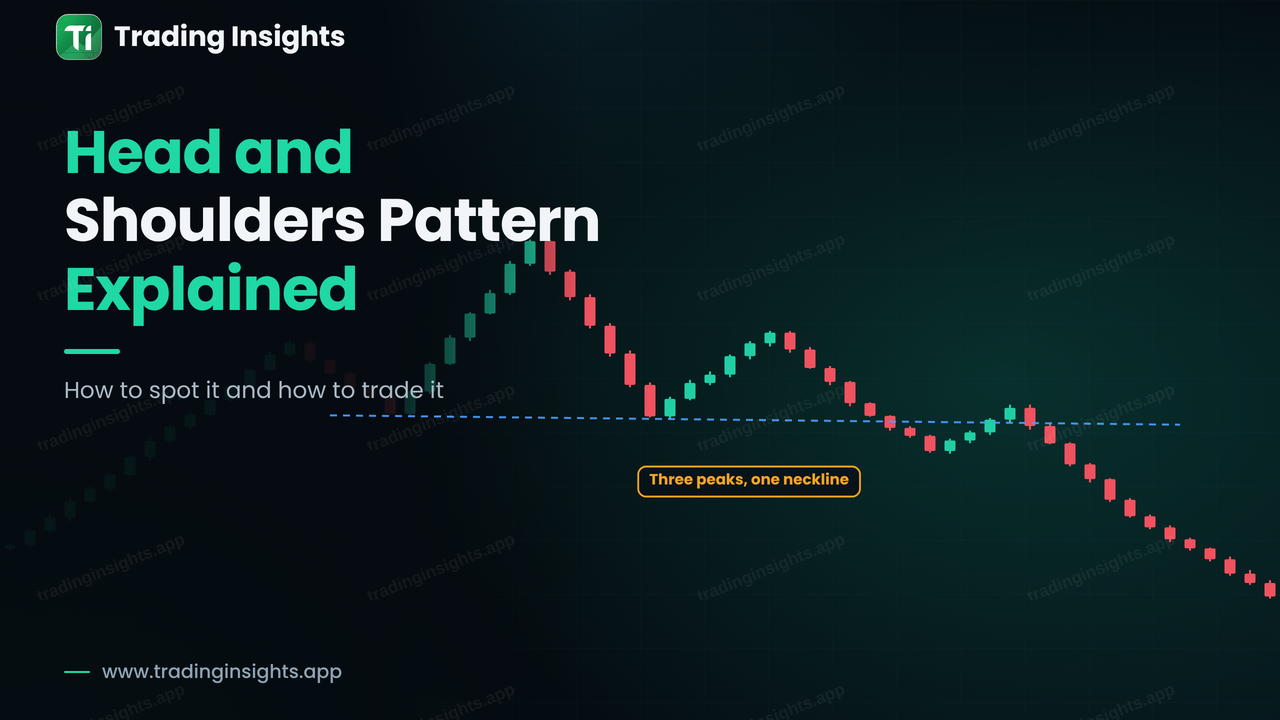
The head and shoulders is one of the best-known reversal patterns in technical analysis. It forms after an uptrend and is made of three peaks: a left shoulder, a higher peak called the head, and a right shoulder that is lower than the head. A line called the neckline joins the lows between the peaks. When price closes below the neckline, the pattern is confirmed and it suggests that the uptrend is over. Its mirror image, the inverse head and shoulders, appears after a downtrend and warns of a bottom. This guide explains each part, how to confirm the pattern, how to measure a target and how to plan a trade with a stop and a position size.
The anatomy of a head and shoulders
The pattern tells a short story about buyers losing control. Each part has a meaning.
- Left shoulder: price makes a high in an uptrend and then pulls back, which is normal.
- Head: price rallies again and makes a higher high, then falls back to about the same low as before. The trend looks intact.
- Right shoulder: price rallies a third time, but this time it fails to reach the height of the head. The buyers are weaker.
- Neckline: the line connecting the two pullback lows. It can be flat or slightly sloped.
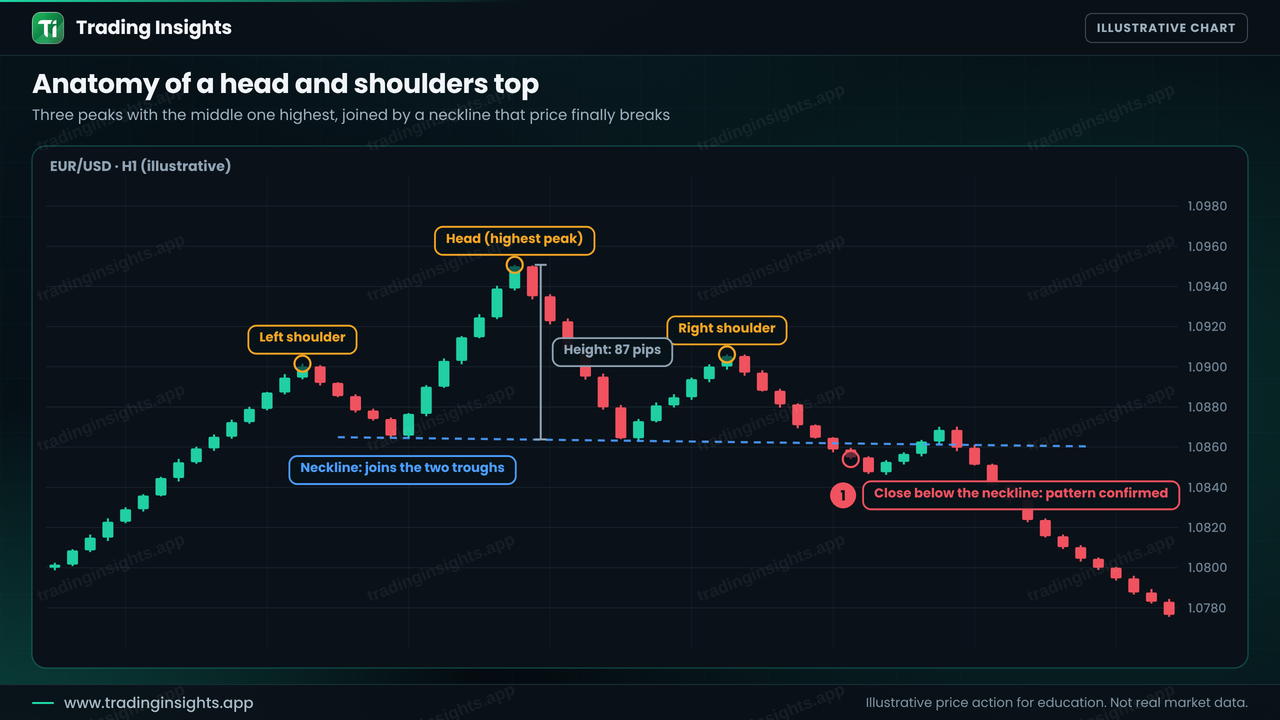
The key idea is that the right shoulder is a lower high. After a series of higher highs, the market has made its first lower high, and when price then breaks the neckline it also takes out the last higher low. That is the same logic as a change of character, and you can read how structure shifts in what market structure is. Until the neckline breaks, however, the pattern is only a possibility, since price can still rise from the right shoulder and the whole shape can turn into a range or a trend continuation.
How to trade the pattern: the neckline retest
A simple plan has three levels: the entry, the stop loss and the target. The most common entry is the retest, when price breaks the neckline, returns to test it from below and is rejected. The target is the height of the pattern, measured from the head to the neckline, projected down from the point where price broke the neckline.
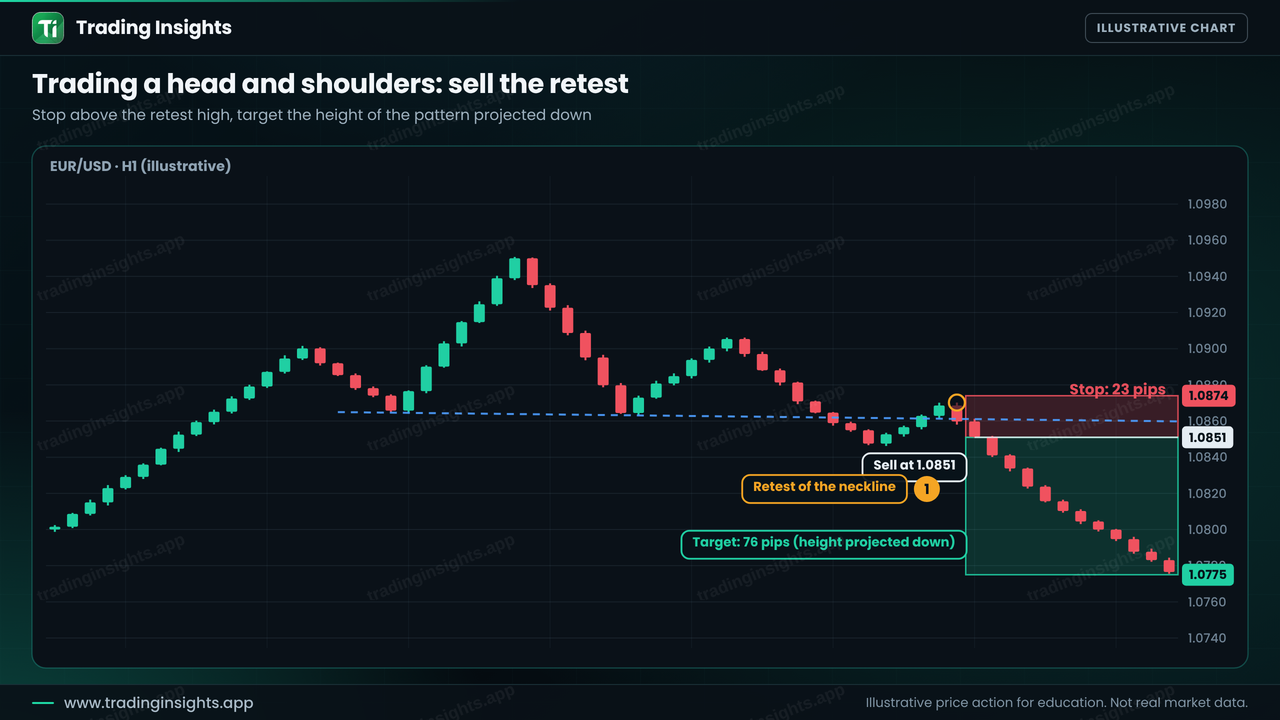
- Entry: 1.0851, after the retest of the neckline is rejected.
- Stop loss: 1.0874, above the retest high (23 pips).
- Take profit: 1.0775 (76 pips from the entry). The pattern height is 87 pips, projected from the neckline break. The ratio is about 1:3.3.
With a $10,000 account risking 1% ($100), the position size is $100 / (23 pips x $10 per pip per lot), about 0.43 lot. If price climbs back above the neckline and the retest high, the pattern has failed and the stop limits the loss to $100. Check your own plan with the position size calculator and the risk-reward calculator.
Some traders put the stop above the right shoulder instead, which is safer but much wider. A wider stop means a smaller position for the same risk, and it lowers the reward-to-risk ratio. Choose your rule in advance, and for the step-by-step method read how to find entry, stop loss and take profit. As with any pattern, price may not retest the neckline at all, and in that case there is no entry.