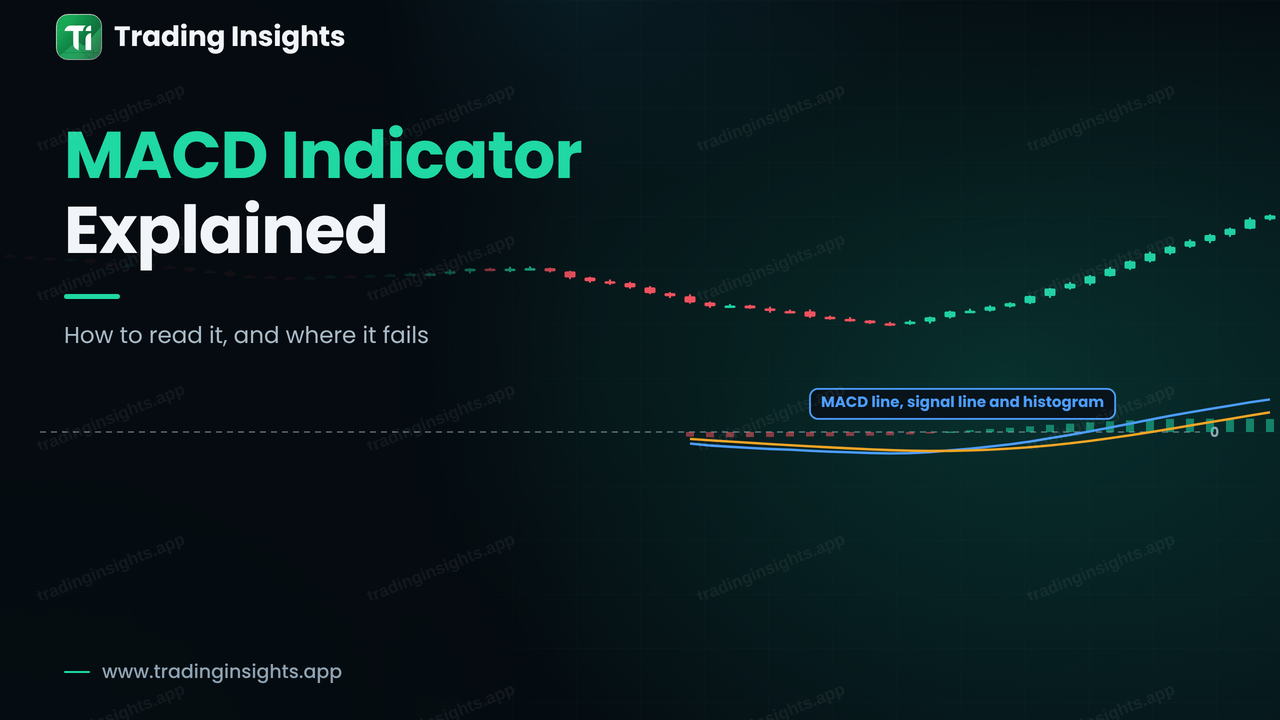
The MACD, short for Moving Average Convergence Divergence, is a momentum indicator that shows how the trend is changing by comparing two moving averages. It appears in a separate pane under the price chart, with two lines and a histogram, and it is one of the most widely used indicators in forex. Traders read it for three things: crossovers between its two lines, the position of the lines compared with the zero line, and divergence between the indicator and price. This guide explains how it is built, how to read each signal, what the weak points are and how to use it sensibly together with price action.
How the MACD is built
The default setting is 12, 26, 9, and each number has a role.
- MACD line: the 12-period exponential moving average (EMA) minus the 26-period EMA. When the faster average is above the slower one, the MACD line is above zero.
- Signal line: a 9-period EMA of the MACD line. It is a smoothed version of the MACD line that is used for crossovers.
- Histogram: the distance between the MACD line and the signal line, drawn as bars. The bars grow when momentum builds and shrink when it fades.
Because the MACD is built from moving averages, it follows the trend and lags behind price. It does not predict anything. What it does well is show whether momentum in the current direction is growing or weakening. If you are new to averages, read moving averages explained first.
Signal-line crossovers and the zero line
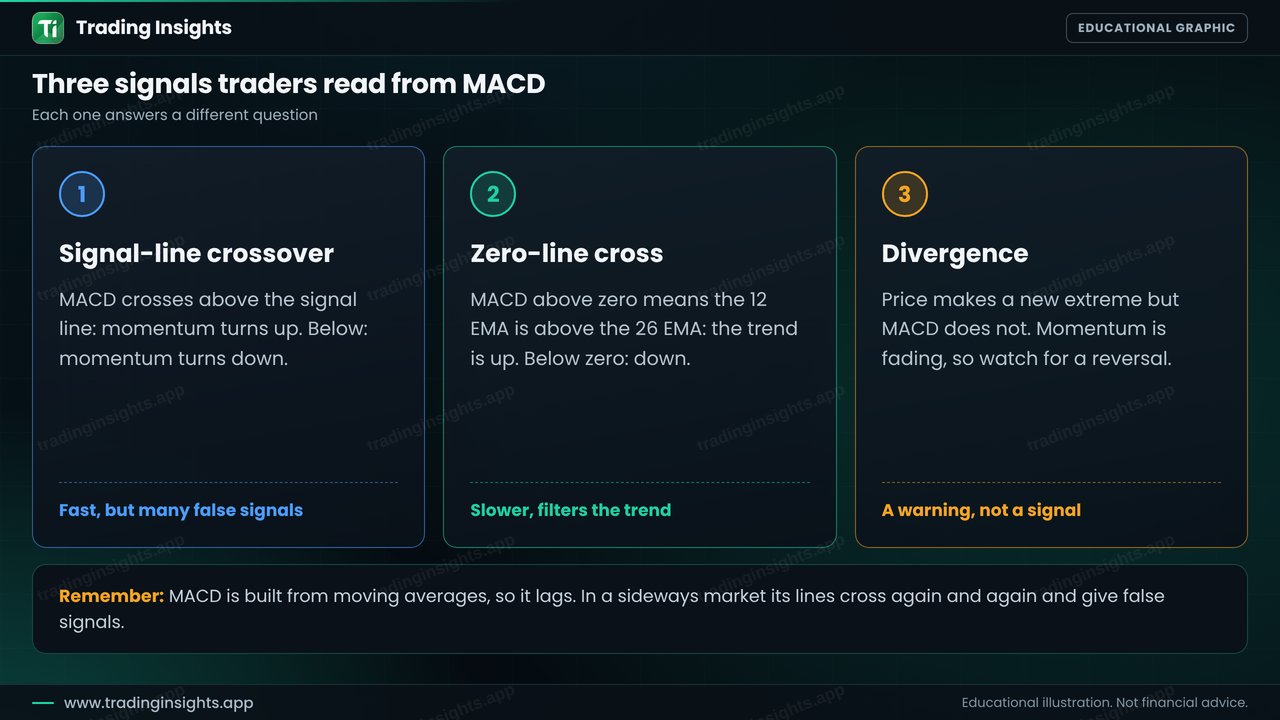
The two most basic signals come from the crossover and the zero line. A bullish crossover happens when the MACD line crosses above the signal line, which says that upward momentum is increasing. A bearish crossover is the reverse. A zero-line cross is slower and bigger: when the MACD line moves above zero, the 12 EMA has moved above the 26 EMA, which means the short-term trend has turned up.
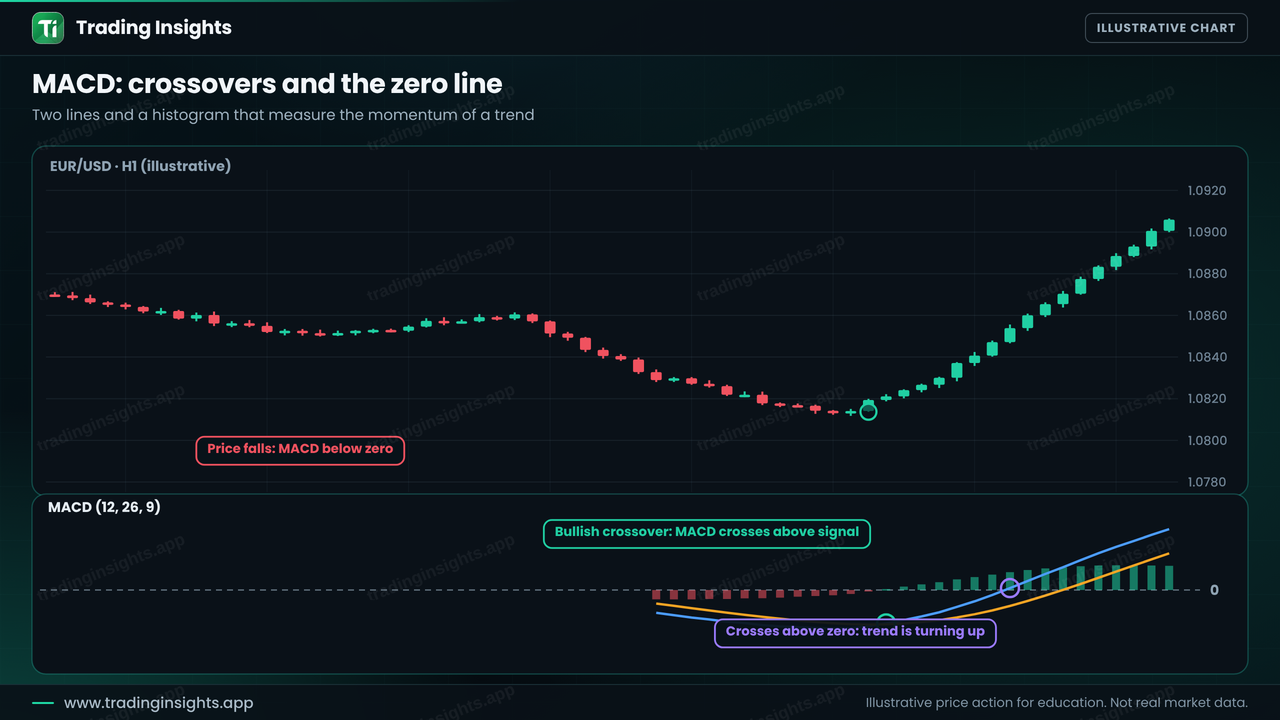
Notice the order in the chart. The crossover came first and the zero-line cross came later, after price had already risen. That is the nature of a lagging indicator: the signal is more reliable the later it comes, but you lose part of the move. Fast signals give a better price and more false alarms, and slow signals give fewer false alarms and a worse price. You cannot have both, so decide which one your plan prefers.
MACD divergence
Divergence appears when price and the MACD disagree. In a bullish divergence, price makes a lower low while the MACD makes a higher low, which suggests that selling pressure is fading even though price is still falling. A bearish divergence is the opposite: price makes a higher high and the MACD makes a lower high.
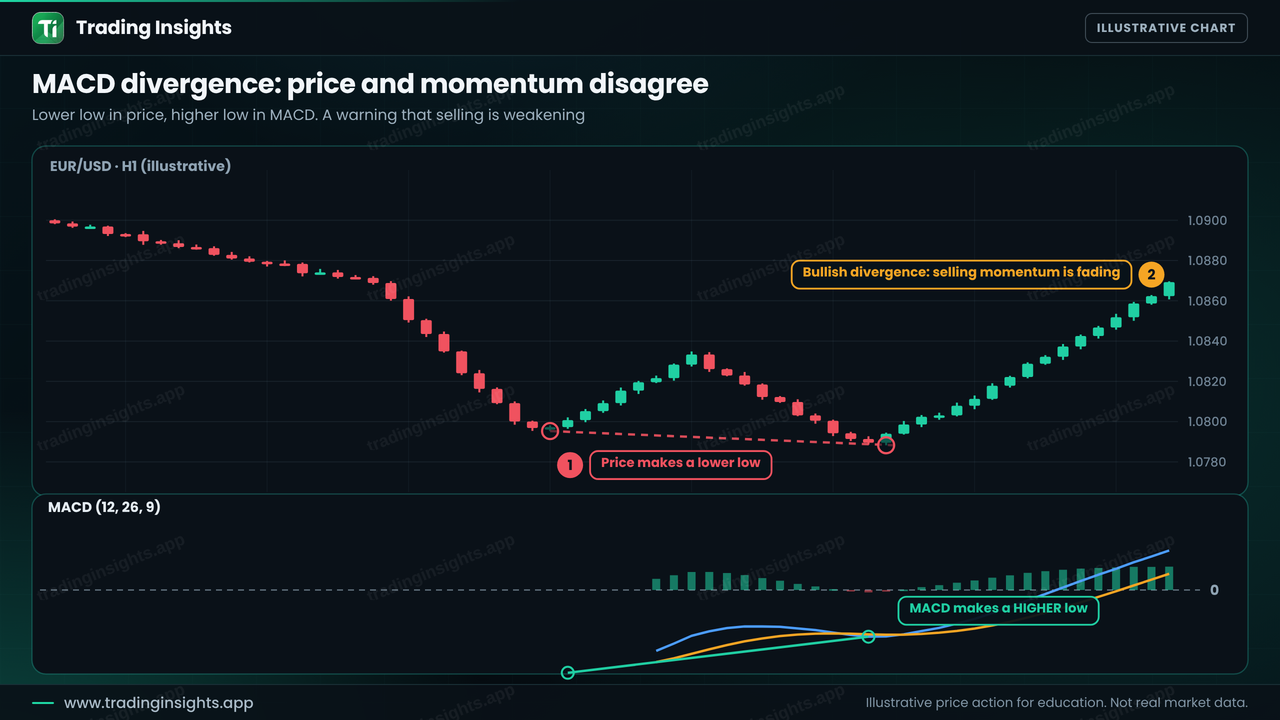
Like the same idea on the RSI, divergence is a warning, not an entry. A trend can keep going while the indicator diverges, so wait for price to confirm, for example with a break of structure or a change of character. You can compare it with RSI divergence, which works in the same way but measures momentum differently.
Three signals and what each one answers
The cards below sum up the three signals. They answer different questions, so they are best used together and not as separate triggers.