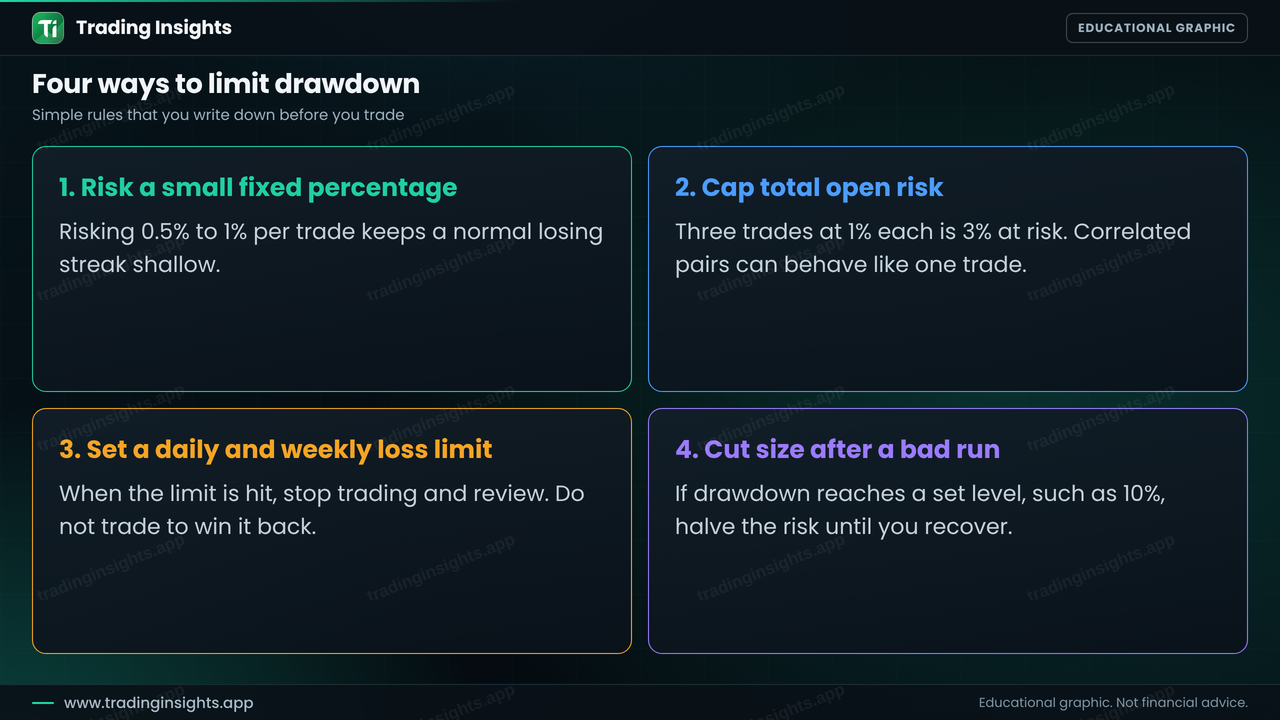
Every trader has losing trades, and every strategy has losing streaks. What decides who survives is not whether losses happen but how deep they get. Drawdown measures that depth, and risk of ruin describes the chance that a run of losses ends the account. Both are about the same simple fact: losses are harder to recover than they look. This guide explains drawdown with simple formulas, shows why a 50% loss needs a 100% gain, shows how often long losing streaks happen even for a good strategy, and gives four practical rules to keep drawdown under control.
What is drawdown?
Drawdown is the fall in your account value from a peak to the next low point, usually shown as a percentage. If your account grows from $10,000 to $12,000 and then falls to $10,200, the drawdown is $1,800, or 15% of the peak ($1,800 / $12,000). The maximum drawdown is the largest such fall over a period, and it is one of the most useful numbers for judging a strategy, because it shows the worst pain you would have had to live through.
A strategy with a high return and a large maximum drawdown can be harder to follow than one with a smaller return and a small drawdown. Most traders abandon a method after a deep drawdown, often right before it recovers. Knowing the likely drawdown in advance helps you decide if you can accept it. You can measure it in your trading journal and in a backtest.
Why recovery is harder than the loss
Losses and gains are not symmetric. After you lose a percentage of your account, the gain needed to return to the start is larger than the loss, because the gain is calculated on a smaller balance. The formula is: gain needed = loss / (1 - loss).
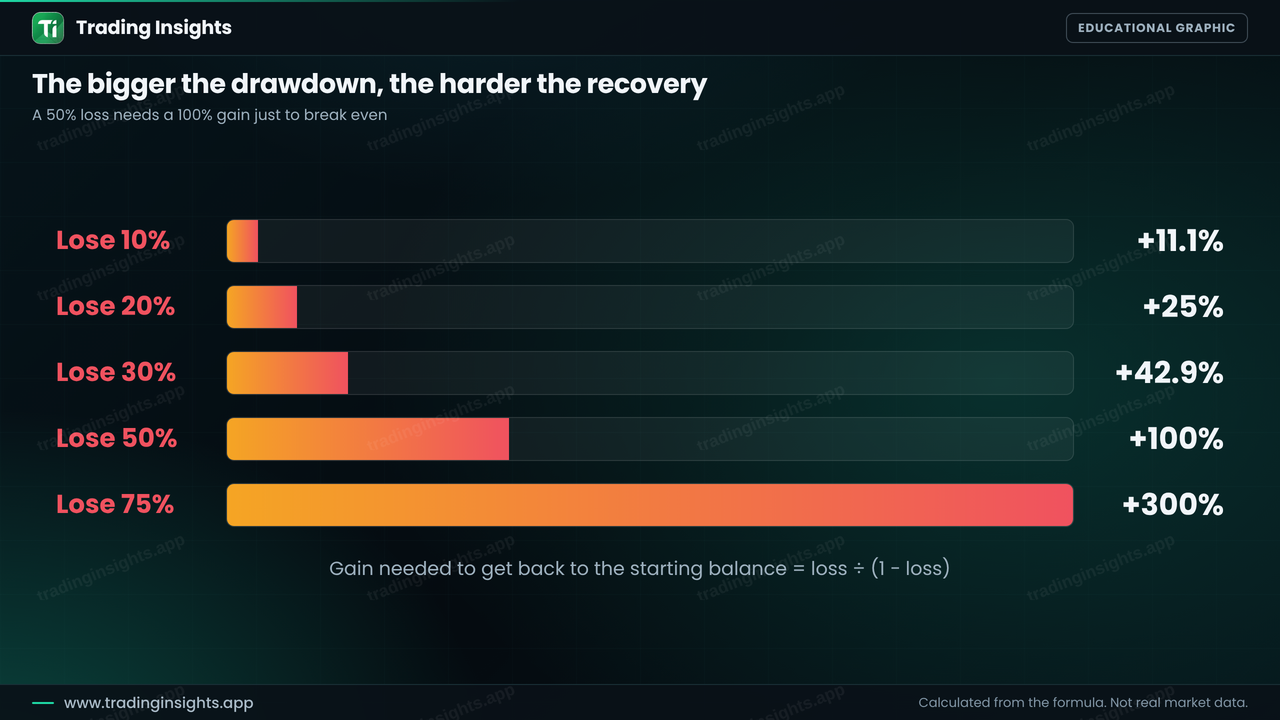
A 10% loss needs an 11.1% gain. A 20% loss needs 25%. A 50% loss needs 100%, which means doubling the account. A 75% loss needs 300%. The numbers rise faster and faster, and this is why professional traders treat the first priority as not losing a large part of the account, and the second as making profit. A small drawdown can be recovered in a few good trades, while a large one can take a year or end your trading career.
Losing streaks are normal
Even a strategy with an edge will have runs of consecutive losses. To see how common they are, I ran a simple simulation of 20,000 random sequences of 100 trades with a 50% win rate. About 55% of the sequences contained a run of six or more losses in a row, about 17% contained eight or more and about 4% contained ten or more. With a 40% win rate, which is common for strategies that win bigger than they lose, the average longest losing streak over 100 trades was about eight, and ten or more occurred in about one run in five. These are simulations of random outcomes and not real market results, but they show an important point: a streak of six or eight losses is not a sign that something broke. It is expected.
The question is what such a streak does to your account, and that depends on your risk per trade.
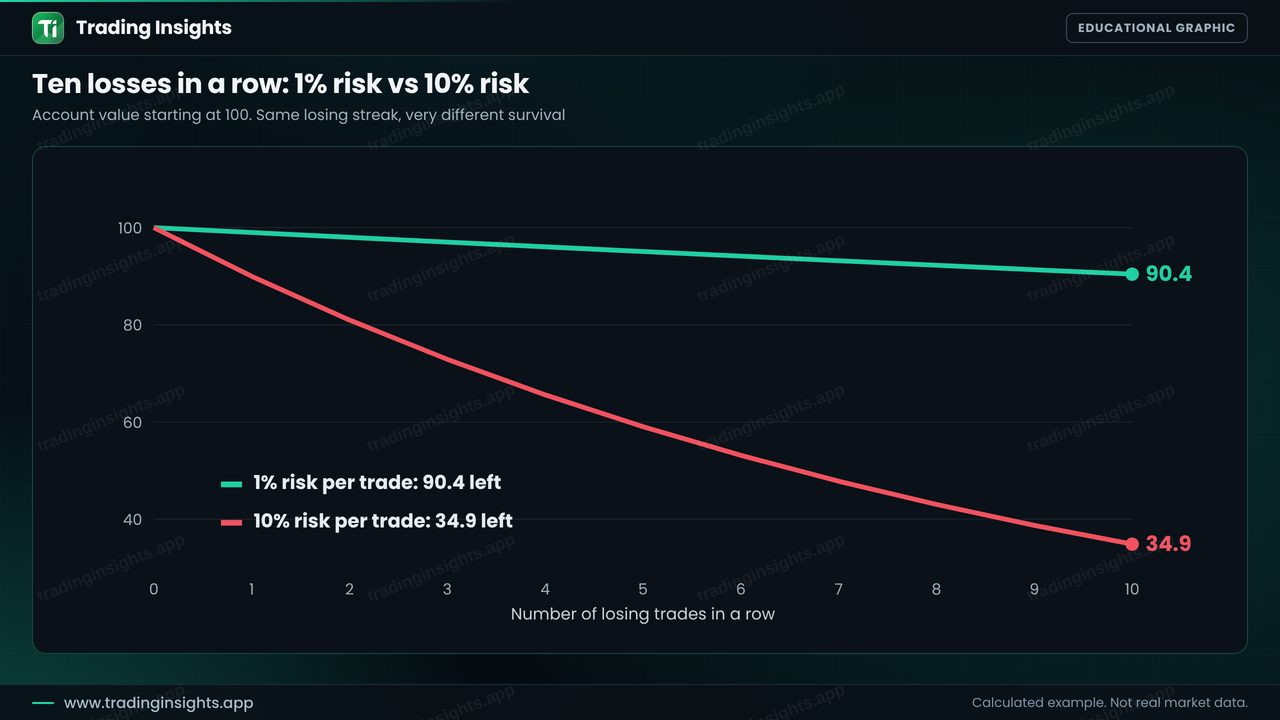
With 1% risk, ten losses in a row leave about 90.4% of the account (0.99 to the power of 10), a drawdown you can recover from. With 10% risk, the same streak leaves about 34.9% (0.9 to the power of 10), and you now need a gain of about 187% just to get back to the start. The strategy is the same. Only the size is different.
What is risk of ruin?
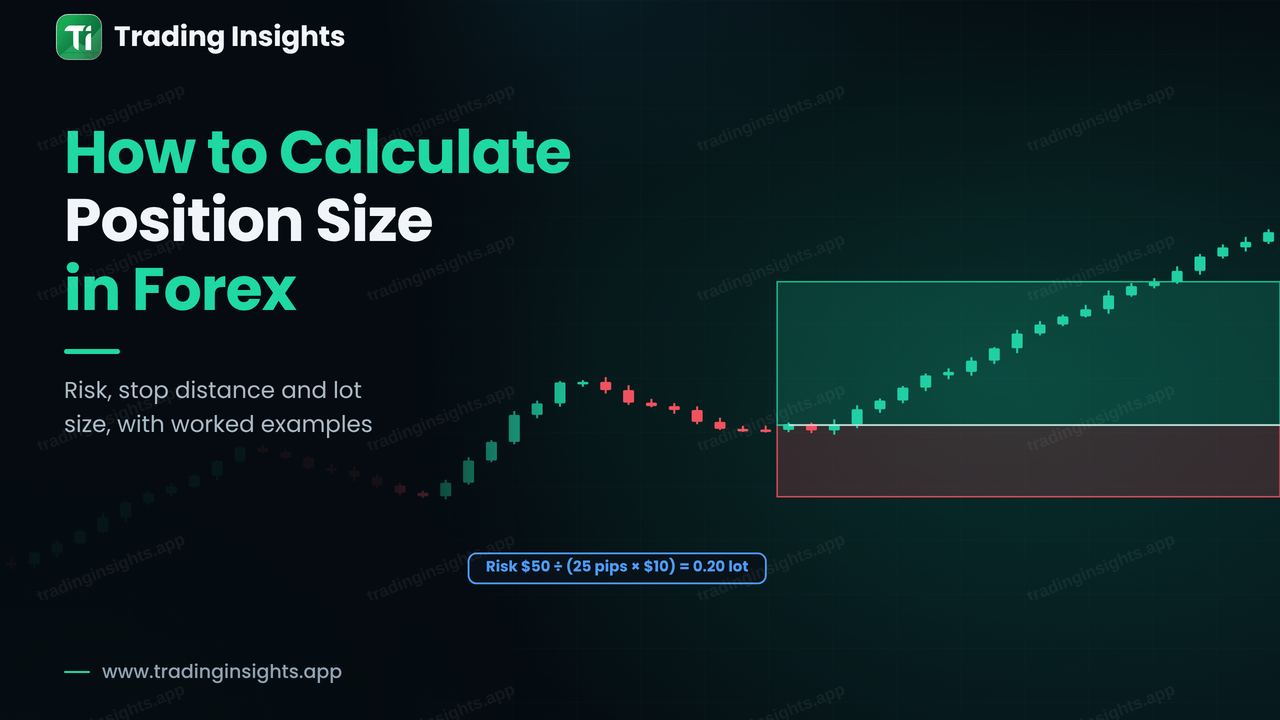
Risk of ruin is the probability that you lose so much of your account that you cannot continue, or that recovery is realistically impossible. It depends on three main things: your win rate, your average reward-to-risk ratio and, most strongly, the percentage you risk on each trade. A strategy with a good edge can still have a high risk of ruin if each trade risks a large share of the account, and a strategy with a small edge can be quite safe if each trade risks very little. That is why the position size, which you choose, matters more than the entry, which you cannot control. The formulas are in how to calculate position size, and reward-to-risk is covered in how to calculate risk-to-reward ratio.