The Relative Strength Index (RSI) is a momentum indicator that measures how fast and how far price has moved recently, on a scale from 0 to 100. Traders use it to judge whether a move is stretched, which is why readings above 70 are called overbought and readings below 30 are called oversold. It was created by J. Welles Wilder and is usually calculated over 14 periods. This guide explains how the RSI is calculated, what the levels really mean, how divergence works, and why treating 70 and 30 as automatic sell and buy signals is one of the most common mistakes.
How the RSI is calculated
You do not need to calculate it by hand, because every platform plots it, but understanding the idea helps you read it correctly. The RSI compares the average gain on up candles with the average loss on down candles over the last 14 periods.
- RS (relative strength) = average gain / average loss.
- RSI = 100 - (100 / (1 + RS)).
If price has mostly risen, the average gain is large compared with the average loss, so the RSI moves toward 100. If price has mostly fallen, it moves toward 0. When gains and losses are balanced, the RSI sits near 50. The key point is that the RSI measures momentum, which is the speed of a move, and not value or direction on its own.
Overbought and oversold: what 70 and 30 really mean
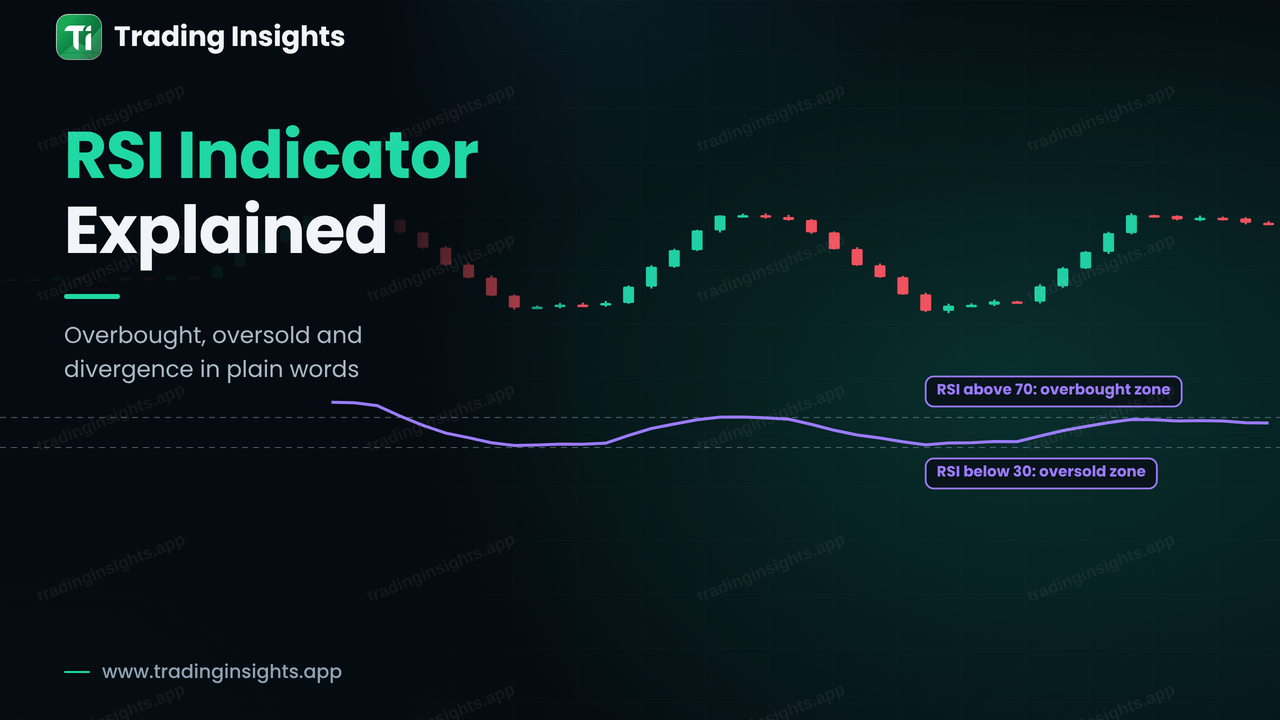
An RSI above 70 says that recent moves have been mostly up and fast. An RSI below 30 says they have been mostly down and fast. In a sideways market, such extremes often line up with turning points, because price tends to swing back inside the range.
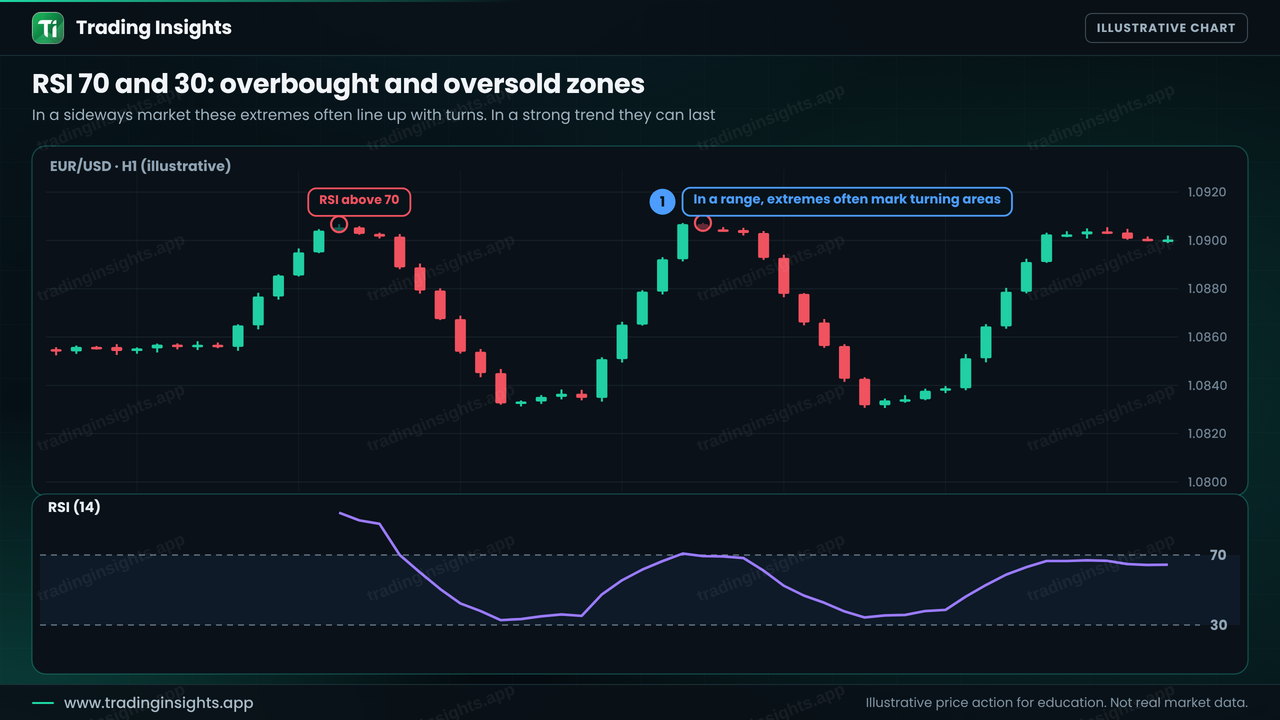
The warning is that overbought does not mean "sell" and oversold does not mean "buy". In a strong trend, the RSI can stay above 70 for a long time while price keeps rising, because strong momentum is exactly what keeps the RSI high. Selling every overbought reading in an uptrend is a quick way to lose money. A better use is to treat an extreme as a prompt to look for a reversal signal, such as a break of structure, before acting.
RSI divergence
Divergence happens when price and the RSI disagree. In a bearish divergence, price makes a higher high, but the RSI makes a lower high. It shows that the second push up had less momentum than the first, which is a sign that buyers are tiring. A bullish divergence is the opposite: price makes a lower low, but the RSI makes a higher low.
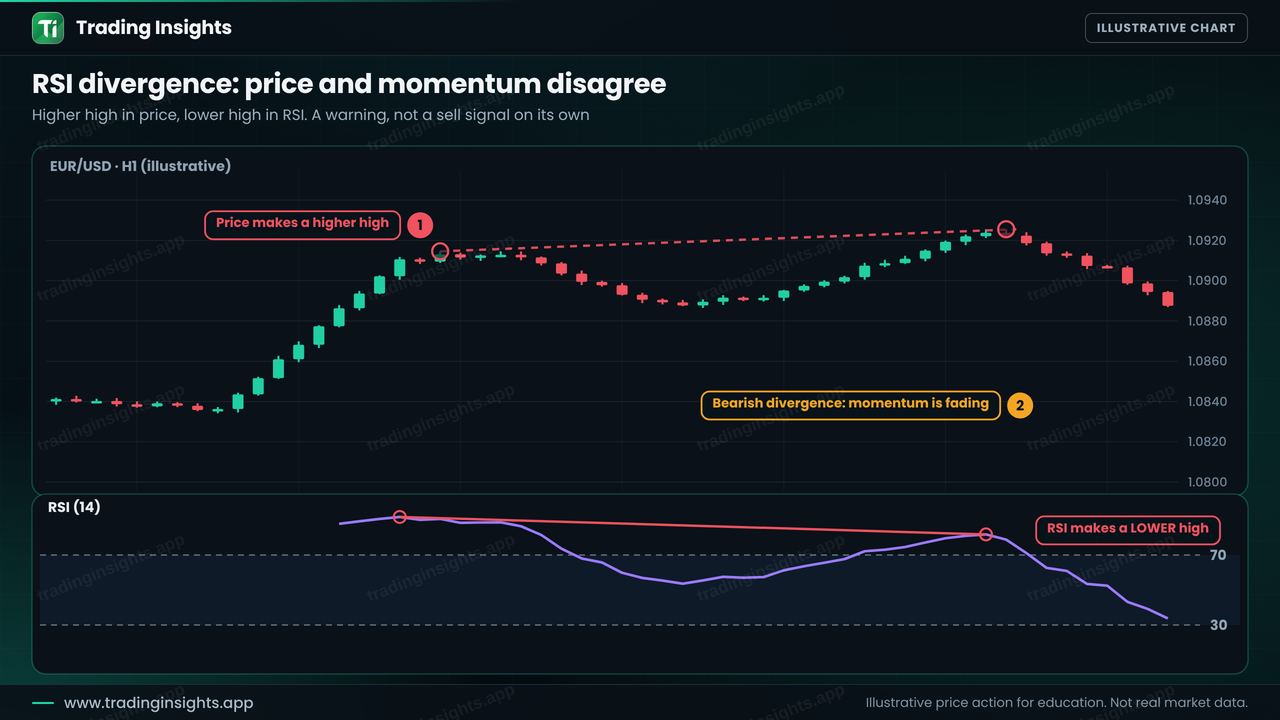
Divergence is a warning, not a signal. It can appear several times before a trend actually turns, and in strong trends it often fails. Most traders wait for confirmation from price, such as a change of character, before they act. If divergence appears at a key area, such as after a sweep of equal highs, it deserves more attention than divergence in the middle of nowhere.
Three ways to use the RSI
The same indicator can do three different jobs, depending on whether the market is ranging or trending. The cards below show each one.
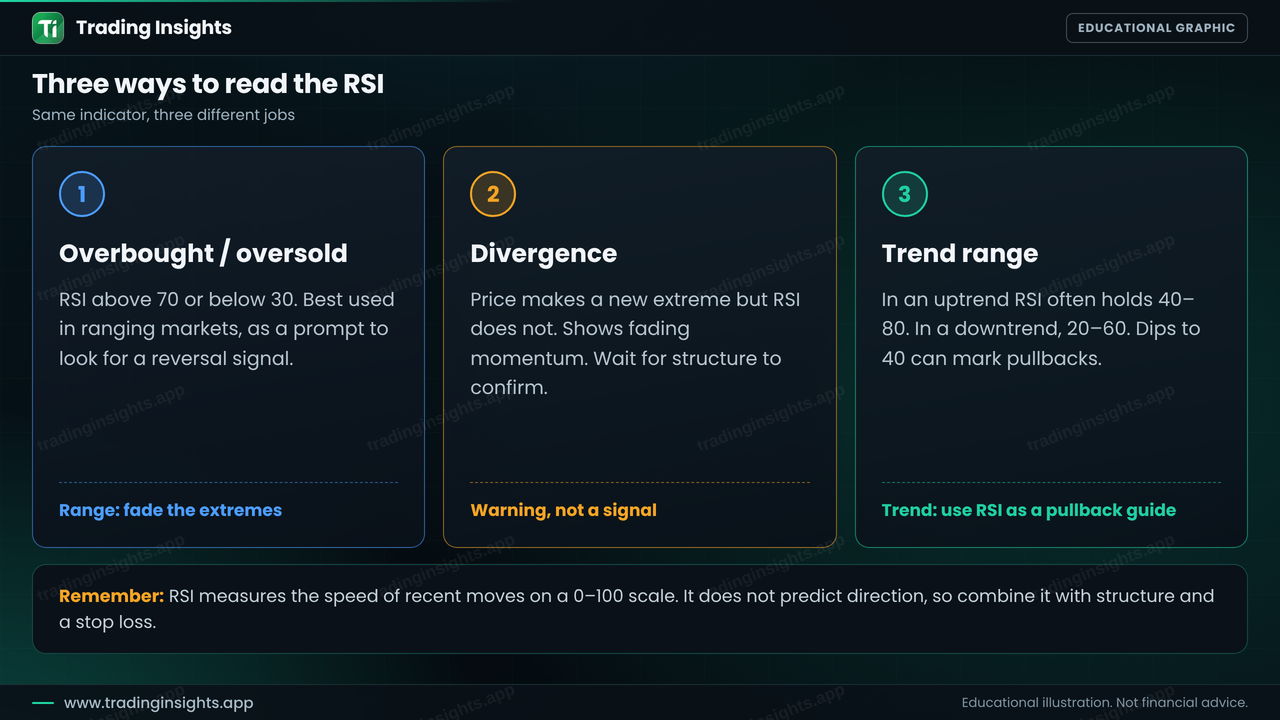
- Overbought and oversold. Best in ranging markets, as a prompt to look for a reversal. Weak in strong trends.
- Divergence. A warning that momentum is fading, which needs confirmation from price.
- Trend range. In an uptrend the RSI often holds between about 40 and 80, and in a downtrend between about 20 and 60. A dip to the 40 area in an uptrend can mark a pullback to watch, and a failure to hold it can warn that the trend is weakening.