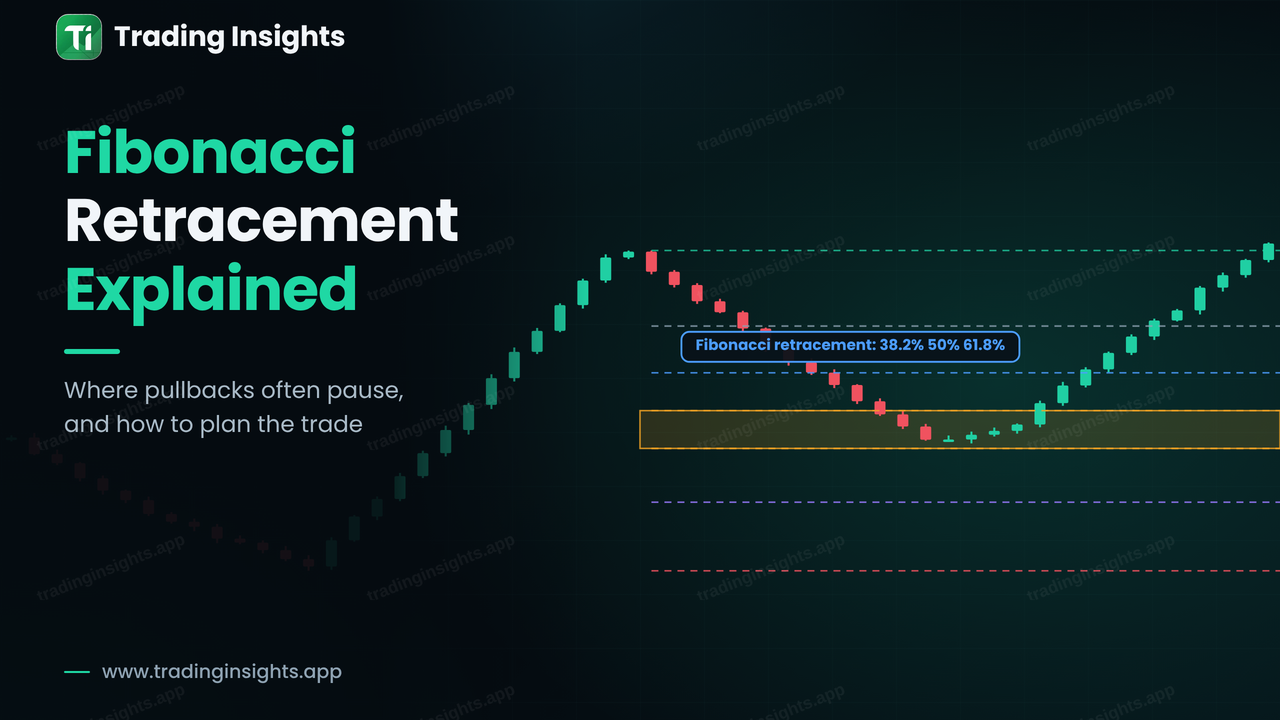
Fibonacci retracement is a tool that measures how far price has pulled back inside a trend. You draw it from a swing low to a swing high, and it plots horizontal levels at set percentages of that move: 23.6%, 38.2%, 50%, 61.8% and 78.6%. Traders watch these levels as areas where a pullback may pause before the trend continues. This guide explains where the numbers come from, how to draw the tool correctly, what each level means, and how to turn it into a trade plan with an entry, a stop and a target.
Where the Fibonacci numbers come from
The levels are based on the Fibonacci sequence: 0, 1, 1, 2, 3, 5, 8, 13, 21, 34, 55, 89 and so on, where each number is the sum of the previous two. Divide a number by the one after it, and the result settles near 0.618 (for example 34 / 55 is about 0.618). Divide a number by the one two places after it, and you get about 0.382 (21 / 55). The 23.6% level comes from dividing by the number three places after (13 / 55), and the 78.6% level is the square root of 0.618. The 50% level is not a Fibonacci ratio at all, but traders include it because the halfway point of a move is widely watched.
It is important to be honest about what this means. There is no proof that markets respect these ratios. They work, to the extent that they do, partly because many traders watch the same levels and place orders there. Treat them as areas of interest, not as exact turning points.
How to draw Fibonacci retracement levels
- Find a clear trend leg. Choose an obvious swing with a clean start and end, not a choppy range.
- In an uptrend, click on the swing low and drag to the swing high. In a downtrend, click on the swing high and drag to the swing low.
- Read the levels. They show how much of the move price has given back.
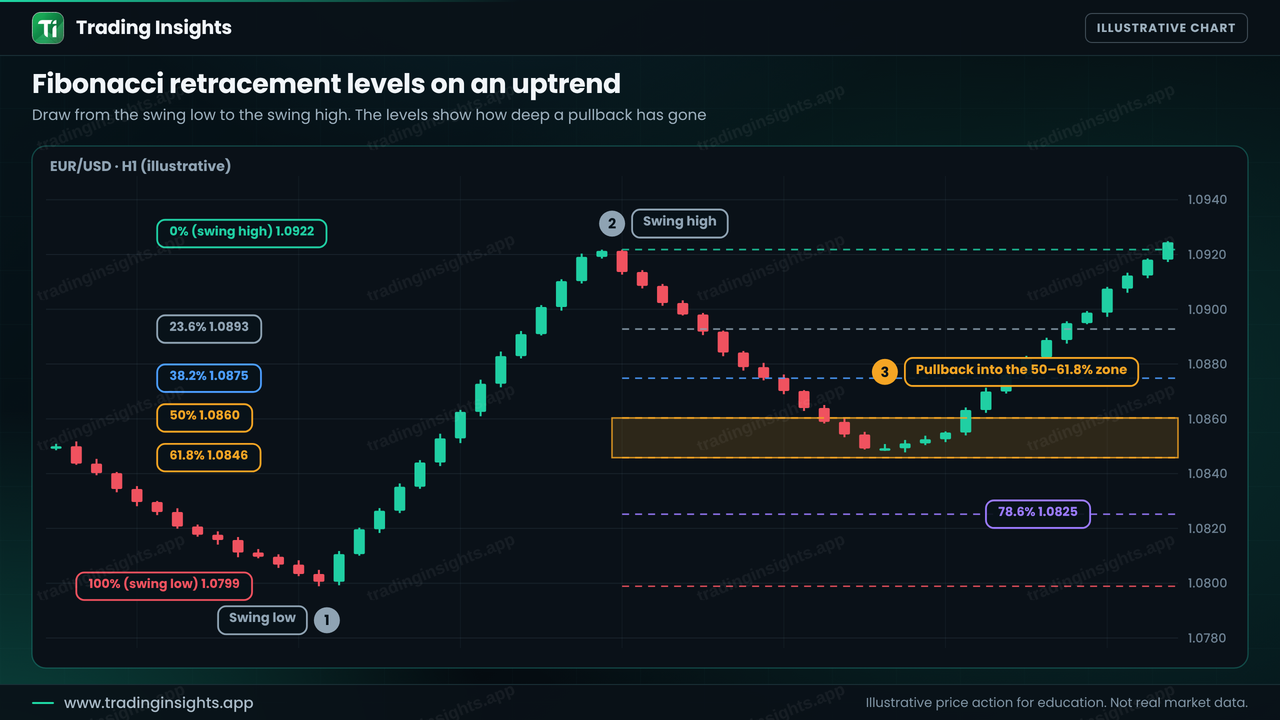
In this example the swing low is about 1.0799 and the swing high is about 1.0922, a move of 123 pips. The levels fall at 1.0893 (23.6%), 1.0875 (38.2%), 1.0860 (50%), 1.0846 (61.8%) and 1.0825 (78.6%). The shaded band between 50% and 61.8% is sometimes called the "golden zone" and is the area many traders focus on.
What each level means
Each level describes how deep a pullback has gone, and a deeper pullback usually says something about the strength of the trend that came before it. The cards below summarise the five main levels.
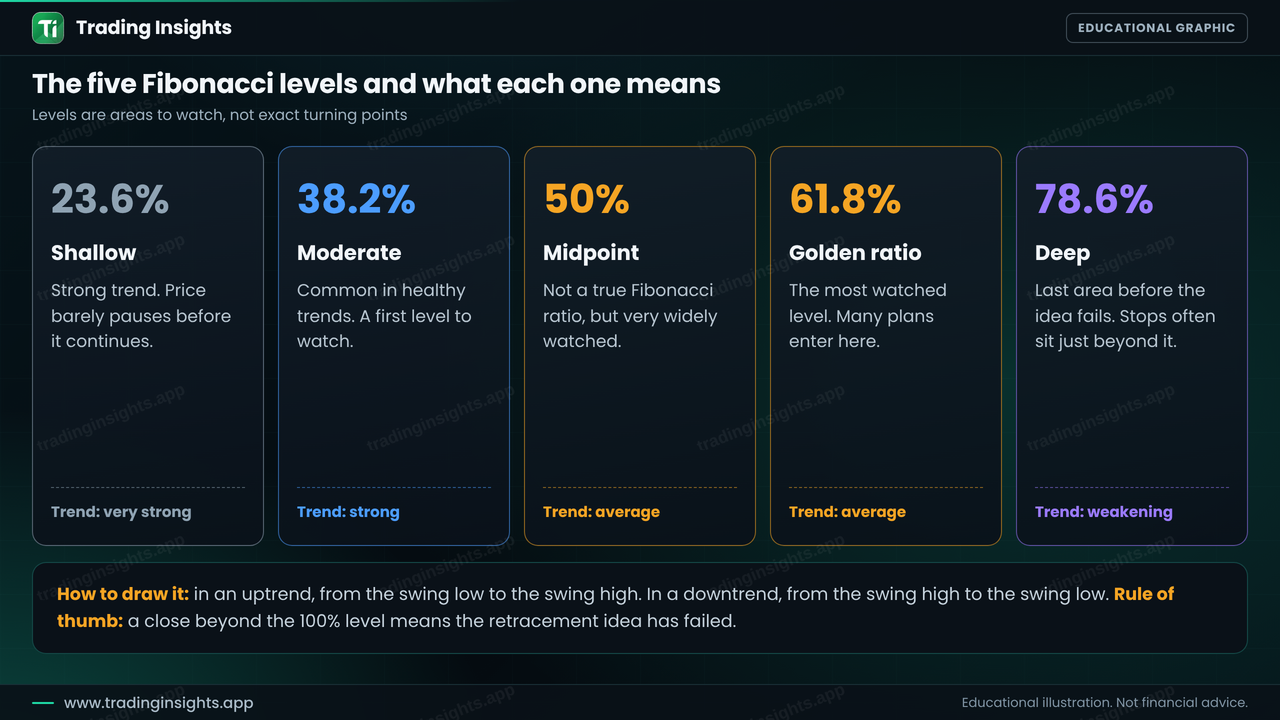
| Level | What a pullback to it suggests |
|---|---|
| 23.6% | A shallow pullback, typical of a very strong trend |
| 38.2% | A moderate pullback, common in healthy trends |
| 50% | A halfway pullback, widely watched |
| 61.8% | A deep pullback, the most watched level |
| 78.6% | A very deep pullback. If it fails, the trend may be over |
A rule many traders use is that a close beyond the 100% level, which is the start of the move, means the retracement idea has failed. The deeper the pullback, the weaker the original trend is likely to be.
A Fibonacci pullback trade: a worked example
Here is an illustrative plan on EUR/USD, H1. Price rises from 1.0799 to 1.0922 and then pulls back. You decide to buy a reaction at the 61.8% level, place the stop beyond the 78.6% level and target the previous swing high.
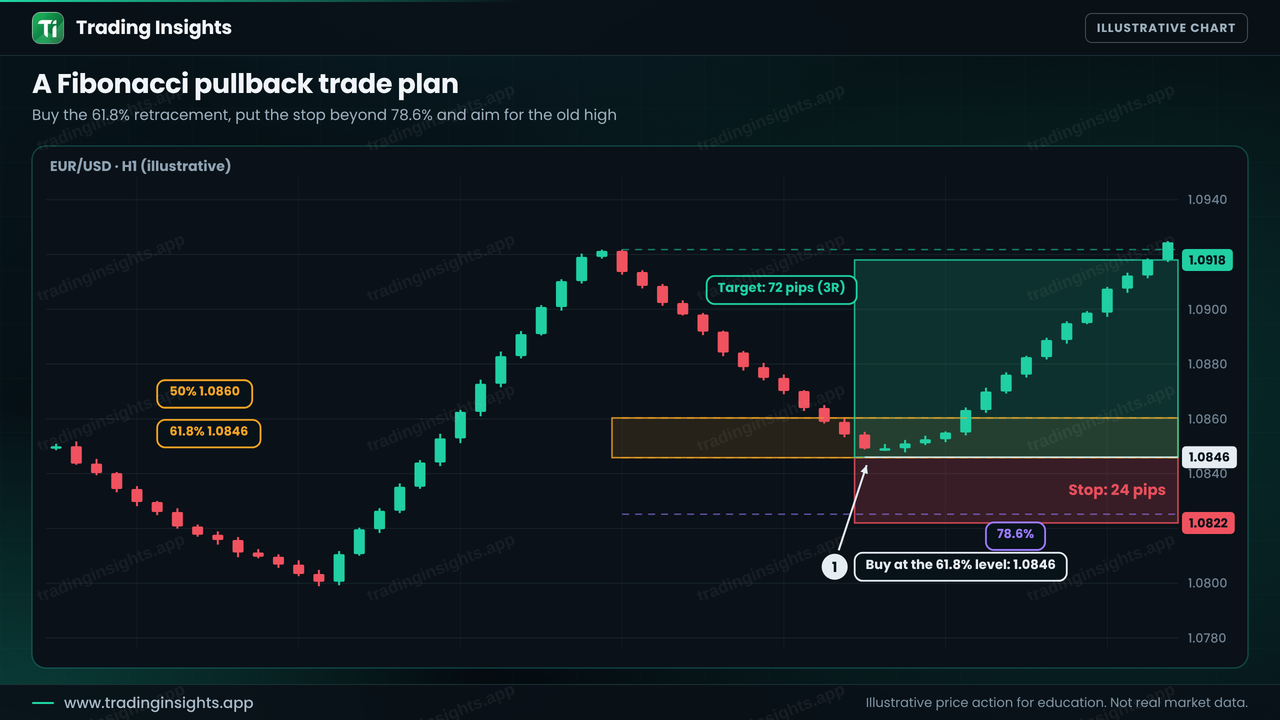
- Entry: 1.0846, at the 61.8% level.
- Stop loss: 1.0822, just below the 78.6% level at 1.0825 (24 pips).
- Take profit: 1.0918, just under the swing high (72 pips). The ratio is 1:3.