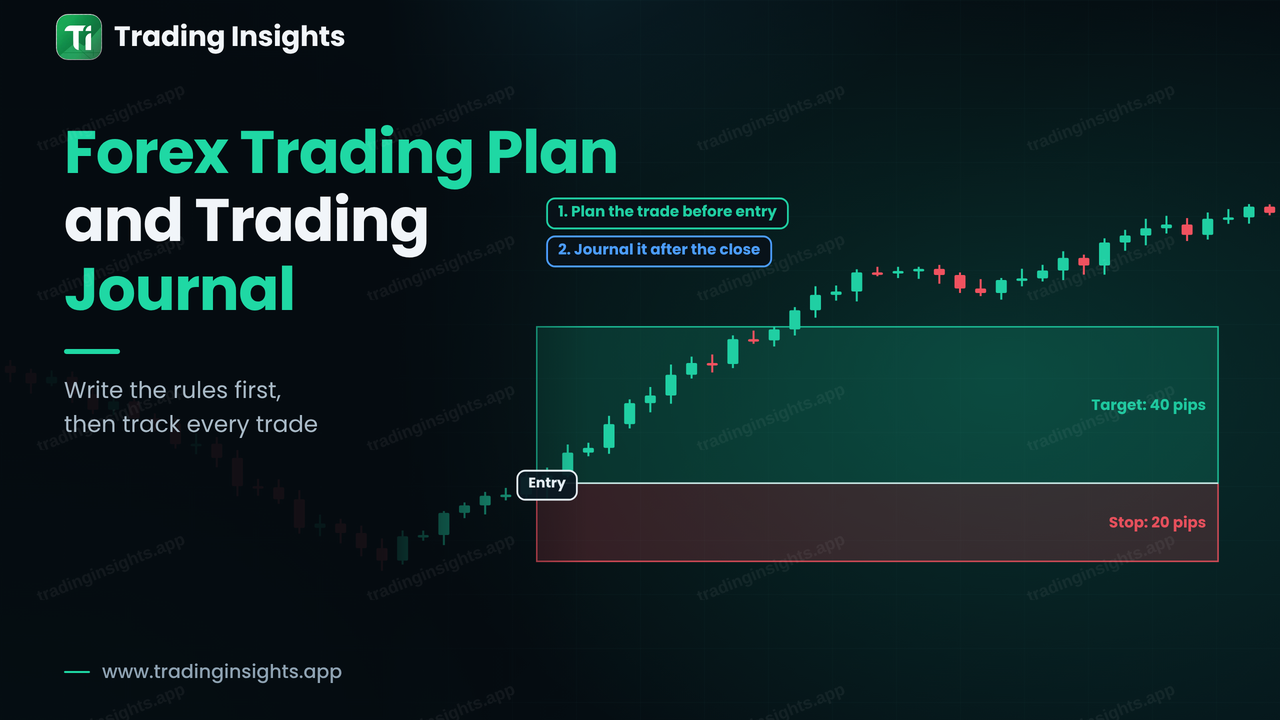
A trading plan is a written set of rules that decides what you trade, when you trade, how you enter and exit, and how much you risk. A trading journal is the record of every trade you take, which shows you whether you followed the plan and whether the plan works. The plan comes first, because it fixes the rules while you are calm. The journal comes after, because it tells you the truth about what happened. Together they turn trading from a series of guesses into a process you can measure and improve. This guide gives you a sample plan with eight sections, a journal entry example and a method for a weekly review.
Why you need both
A plan without a journal is a set of intentions that nobody checks. A journal without a plan records what happened but has nothing to compare it with. When you have both, you can ask the most useful question in trading: "Did I follow my rules, and do the rules make money?" A losing trade that followed the plan is just a cost of doing business. A winning trade that broke the plan is a bad habit that happened to be rewarded, and it deserves attention. This is also the second half of the process described in how to backtest a forex trading strategy.
The eight sections of a trading plan
Keep the plan short enough to fit on one page. If you cannot read it in two minutes before a session, it is too long to follow. The template below is a sample, and you should change every rule to fit your own style and test it first.
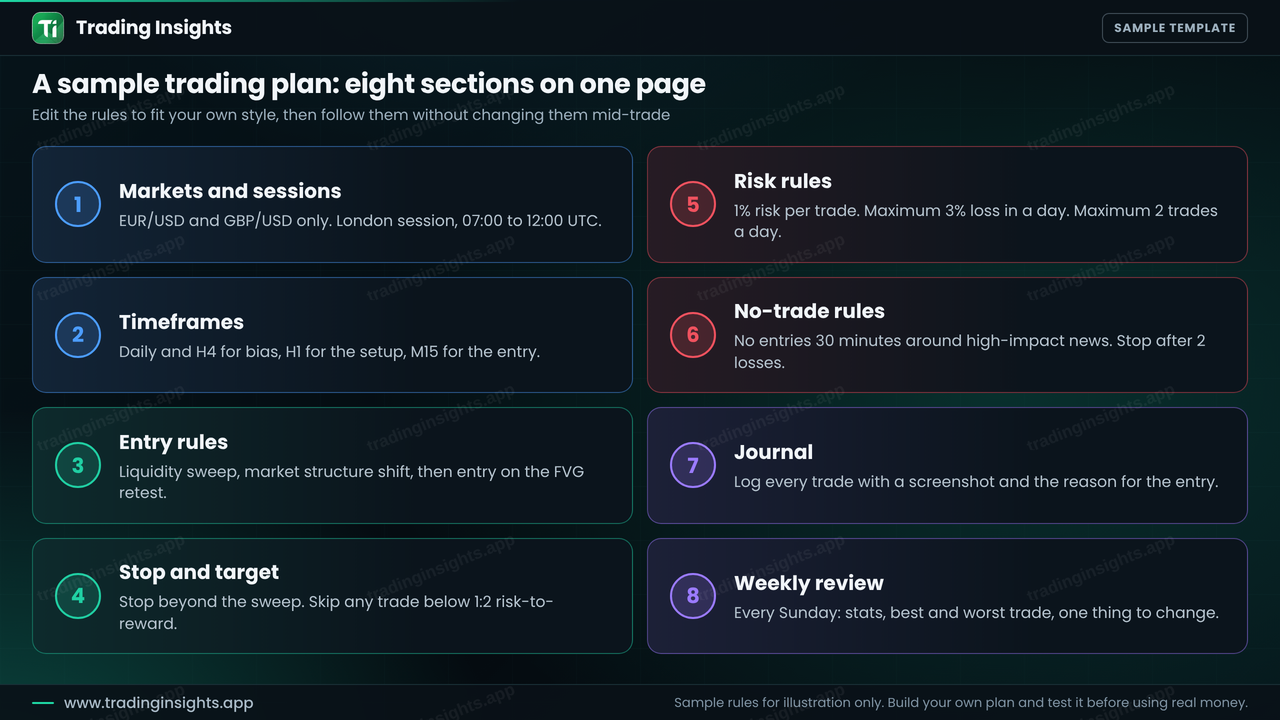
Figure 1: A sample trading plan with eight sections on one page. The rules are for illustration only.
Markets and sessions. Which pairs you trade and in what hours. For example, EUR/USD and GBP/USD only, during the London session, 07:00 to 12:00 UTC. Fewer pairs means you learn how each one behaves. See forex trading sessions explained for choosing hours.
Timeframes. One for bias, one for the setup and one for the entry, such as Daily and H4 for bias, H1 for the setup and M15 for the entry. See top-down analysis in forex.
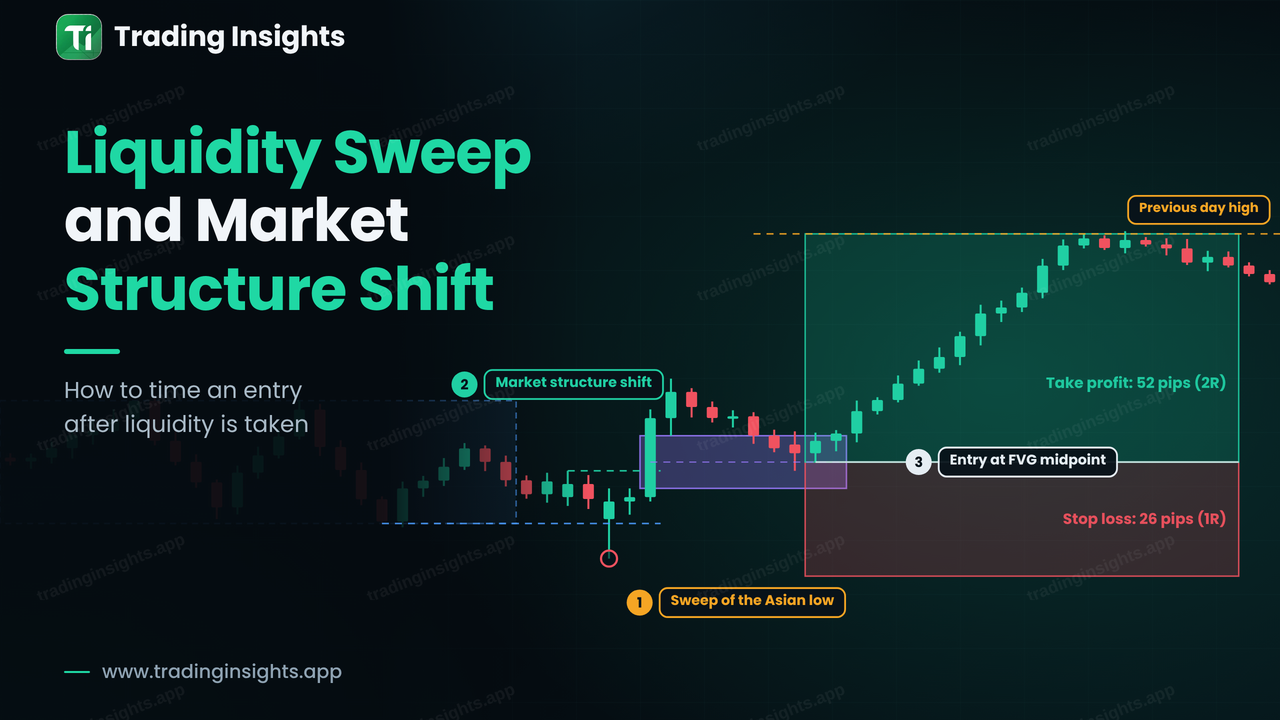
Entry rules. The exact conditions that must be present, such as a liquidity sweep, a market structure shift and an entry on the fair value gap retest. These must be specific enough that another trader could check them on the chart. See the sweep and market structure shift guide.
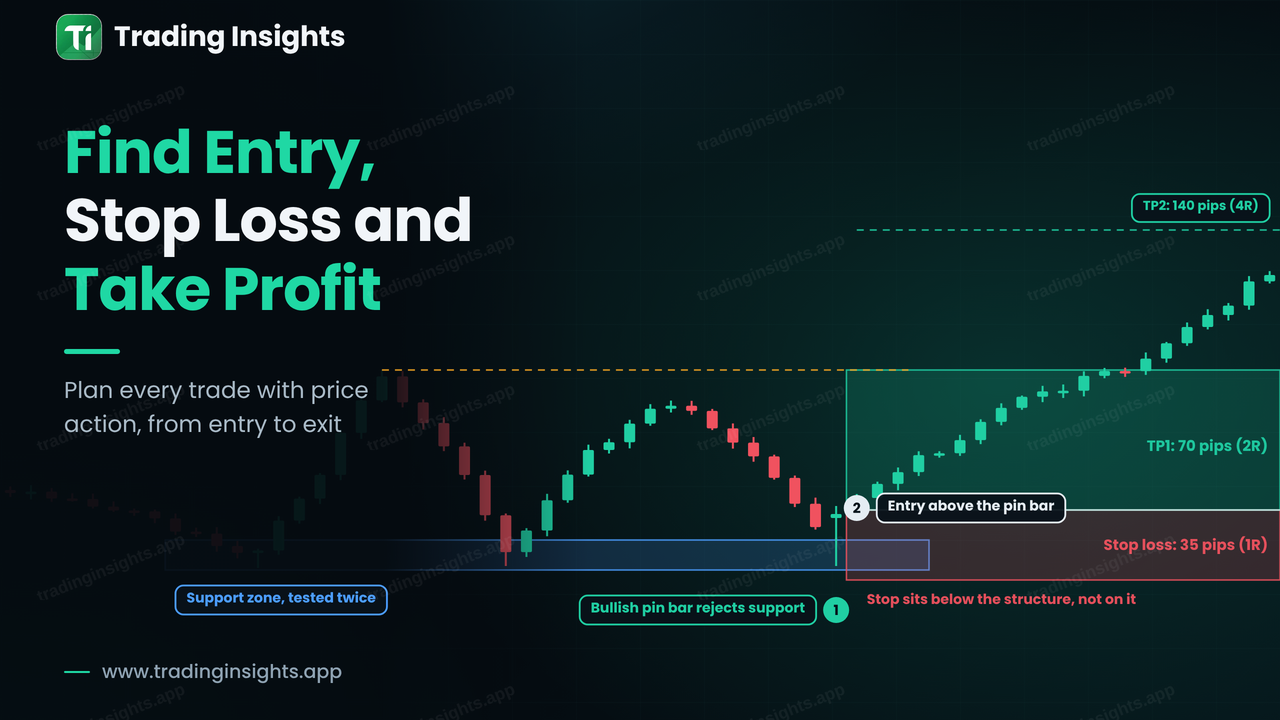
Stop and target. Where the stop goes, how the target is chosen and the minimum risk-to-reward, such as 1:2. Skip any trade that does not meet it.
Risk rules. The percentage risked per trade (for example 1%), a daily loss limit (for example 3%) and a maximum number of trades per day. These rules protect you from your worst days.
No-trade rules. Conditions where you do not trade, such as 30 minutes around high-impact news, or after two losses in a day.
Journal. What you record for every trade and when you record it.
Weekly review. A fixed time to review your journal, find the best and worst trades and choose one thing to change.
Write the rules as yes or no questions
Good rules can be answered with yes or no. "Enter when the market looks strong" is not a rule. "Enter only after a close beyond the last swing high, on a candle at least twice the average size" is. Vague rules let your mood decide, and the entire purpose of the plan is to take mood out of the decision. For examples of checklists, see how to combine BOS, CHoCH and FVG.
What to record in a trading journal
A journal entry should take two or three minutes. Record the same fields every time, so that you can compare trades later.
Date, pair, direction and the setup name.
Entry, stop loss and take profit prices, and the planned risk-to-reward.
Risk in money and in percent, and the position size.
The result in R (the multiple of the risk) and in money.
A chart screenshot with the entry, stop and target marked.
Whether you followed the plan, and any rule you broke.
How you felt before and after, and one lesson.
The emotion field is not a luxury. Patterns such as taking worse setups after a loss or feeling rushed before news show up here before they show up in your results.
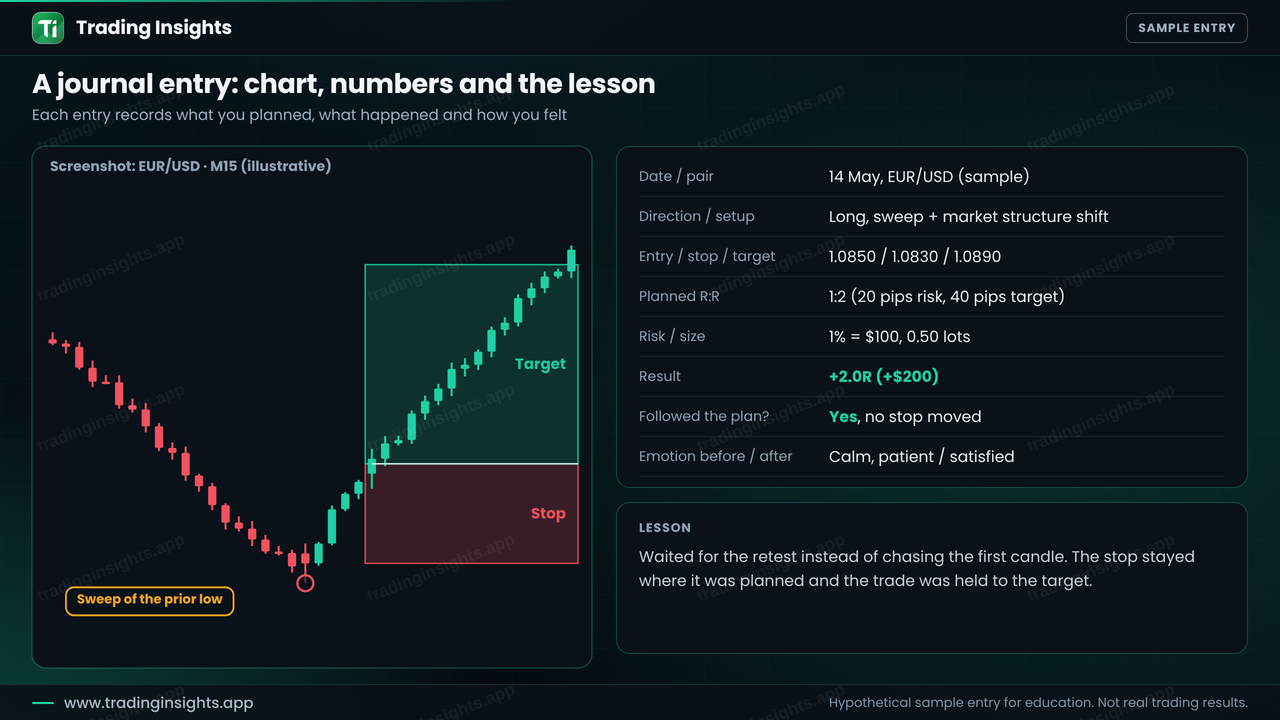
A journal entry example
Here is what one completed entry looks like. The chart screenshot, the numbers and the written lesson all sit together, so you can review the trade in a few seconds later.