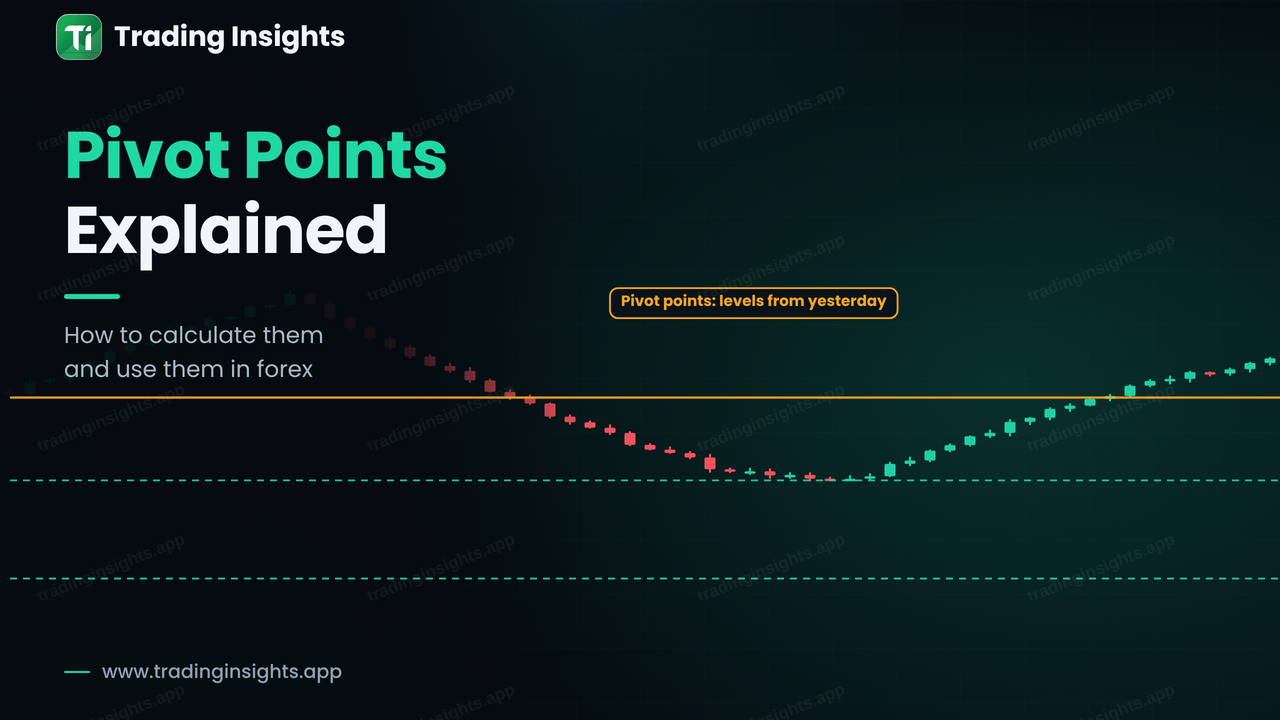
Pivot points are a set of support and resistance levels that you calculate from the previous period's high, low and close. Day traders use them because the levels are fixed at the start of the day, the same for everyone who uses the same formula, and they give clear areas to watch for reactions. The central level is called the pivot point (P), and it sits between resistance levels above (R1, R2) and support levels below (S1, S2). This guide shows the classic formulas with a worked example, how to read the levels, how to plan a bounce trade with a stop and a target, and the limits of the method.
How to calculate classic pivot points
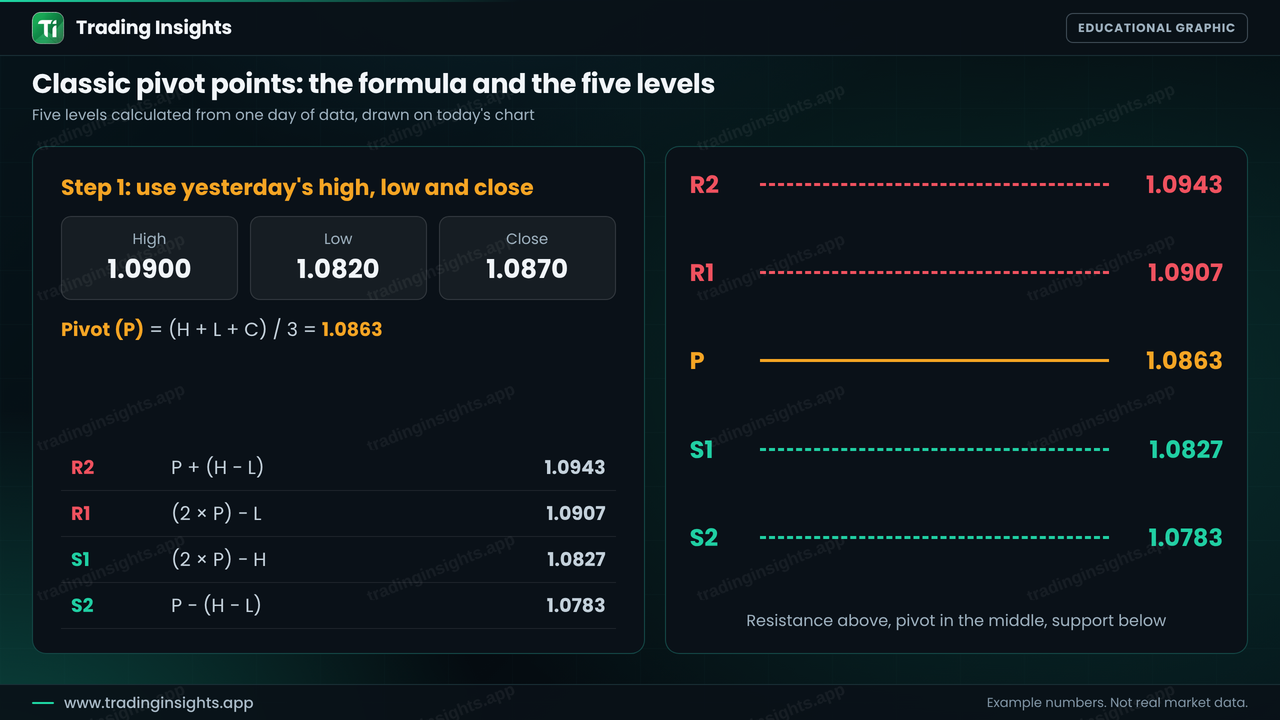
You need three numbers from the previous day: the high (H), the low (L) and the close (C). The central pivot is their average, and the other levels are derived from it.
- Pivot (P) = (H + L + C) / 3
- R1 = (2 x P) - L and S1 = (2 x P) - H
- R2 = P + (H - L) and S2 = P - (H - L)
- R3 = H + 2 x (P - L) and S3 = L - 2 x (H - P)
Take a worked example on EUR/USD, with a previous high of 1.0900, a low of 1.0820 and a close of 1.0870. The pivot is (1.0900 + 1.0820 + 1.0870) / 3 = 1.0863. Then R1 = (2 x 1.0863) - 1.0820 = 1.0907, S1 = (2 x 1.0863) - 1.0900 = 1.0827, R2 = 1.0863 + 0.0080 = 1.0943 and S2 = 1.0863 - 0.0080 = 1.0783.
You do not have to calculate this by hand. Most platforms plot pivot points automatically, and our pivot point calculator will give you the levels from any high, low and close. Understanding the formulas still helps, because it shows that the levels are simply based on the size and position of yesterday's range. A wide previous range creates levels far apart, and a narrow range creates levels close together.
How to read the levels
The pivot point is often treated as the dividing line of the day's bias. If price trades above P, buyers have the upper hand, and R1 and R2 are possible targets. If price trades below P, sellers are stronger, and S1 and S2 are possible targets. The other levels act like ordinary support and resistance: price may pause, reverse or break through.
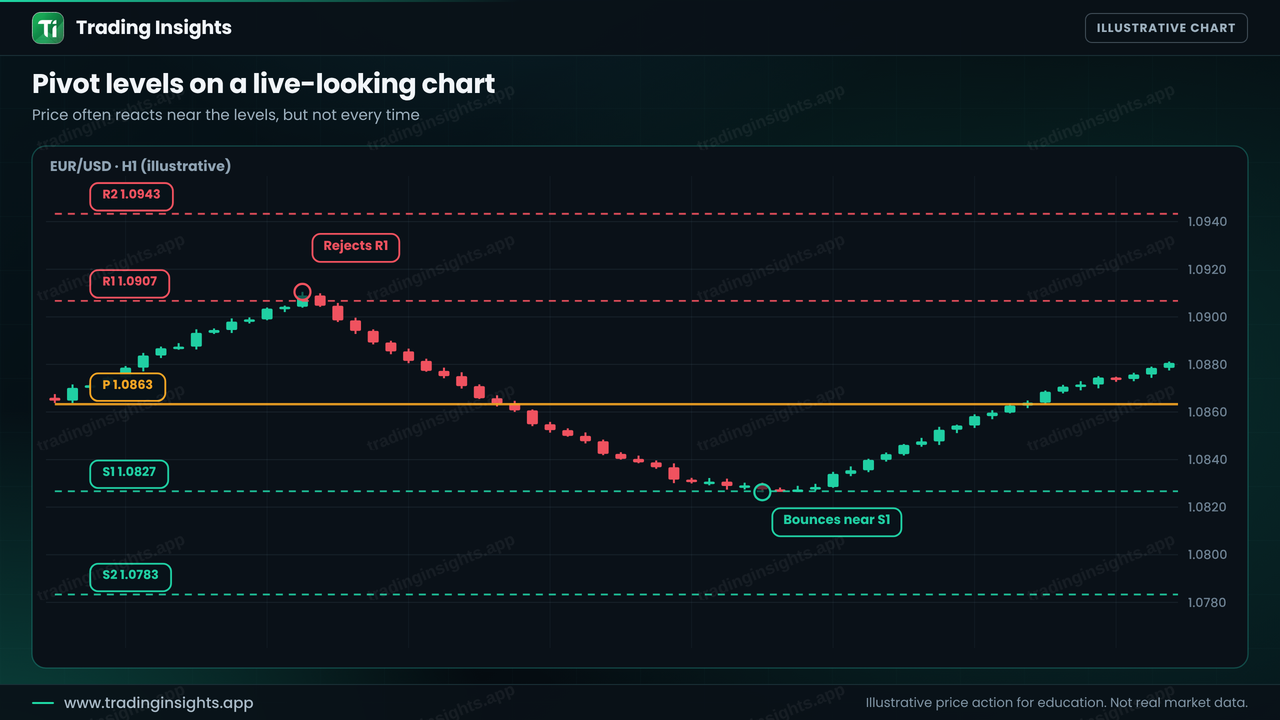
A few points help you use the levels with realism:
- Pivot levels are areas, not exact prices. Price may react a few pips before or after a level.
- They work best in markets that range or trend in an orderly way, and worst on days with major news, when price can pass through several levels at once.
- They are most useful on the intraday timeframes from M5 to H1. The pivot of a weekly or monthly range gives broader levels.
- They are more meaningful where they line up with other levels, such as a previous swing, a round number or an order block. See support and resistance vs supply and demand zones.
A pivot bounce trade: worked example
Here is an illustrative plan using the levels above on EUR/USD, H1. Price falls from R1, passes through the pivot and slows near S1 at 1.0827. The plan is to buy the bounce from S1, place the stop beyond the level and target the pivot.
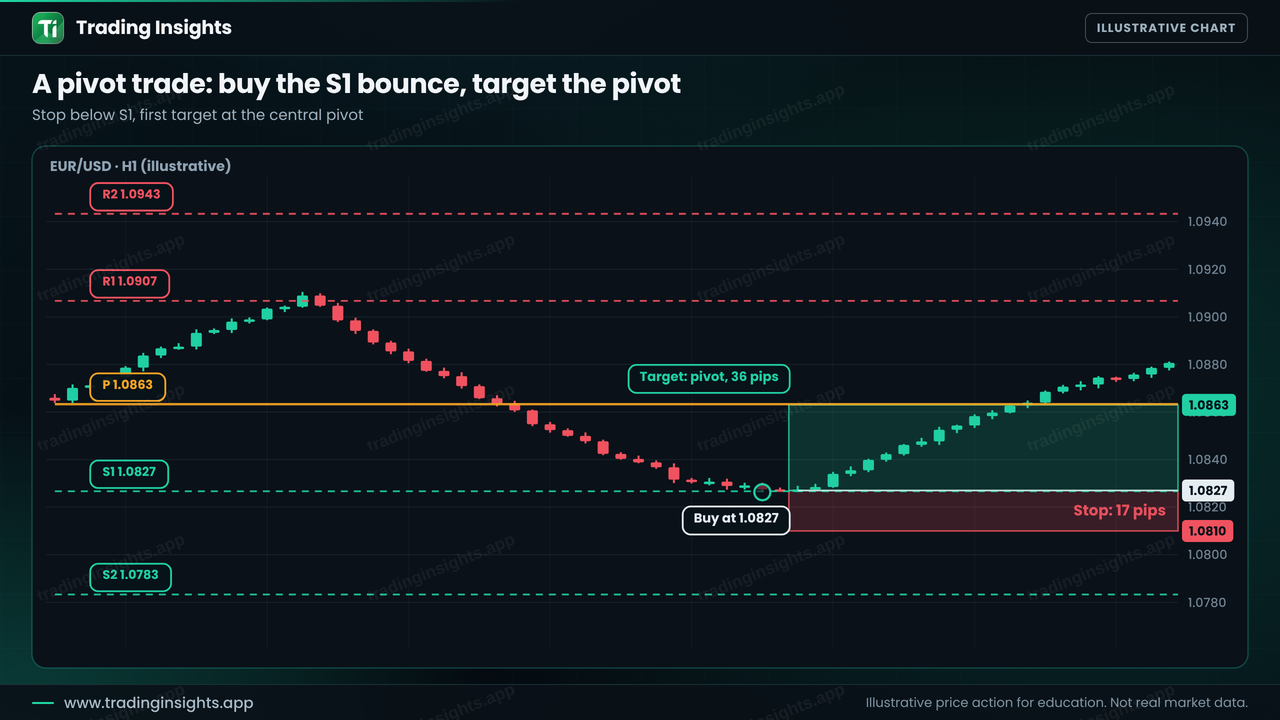
- Entry: 1.0827, at S1, after price shows a reaction.
- Stop loss: 1.0810, below S1 (17 pips).
- Take profit: 1.0863, the pivot (36 pips). The ratio is about 1:2.1.