A moving average (MA) is the average closing price over a set number of recent candles, redrawn on every new candle so it moves along with price. Because it smooths out the noise, it makes the direction of a trend much easier to see. The two most common types are the simple moving average (SMA) and the exponential moving average (EMA). This guide explains how each is calculated, how they differ, how traders use crossovers and pullbacks, and where moving averages fall short. You will also see a worked pullback trade with an entry, a stop and a target.
What a moving average does
Price on a chart is jumpy. A moving average replaces the jumps with a smooth line. If the line slopes up and price stays above it, the trend is up. If the line slopes down and price stays below it, the trend is down. If the line is flat and price keeps crossing it, the market is probably ranging and the line is of little use.
The number you choose is the period. A 20-period average uses the last 20 candles and reacts quickly. A 200-period average uses the last 200 and moves slowly, which is why it is used to judge the long-term trend. A shorter period means more signals and more noise, and a longer period means fewer signals and more delay.
SMA vs EMA: how they are calculated
- Simple moving average (SMA): add up the last N closing prices and divide by N. Every candle in the window has the same weight.
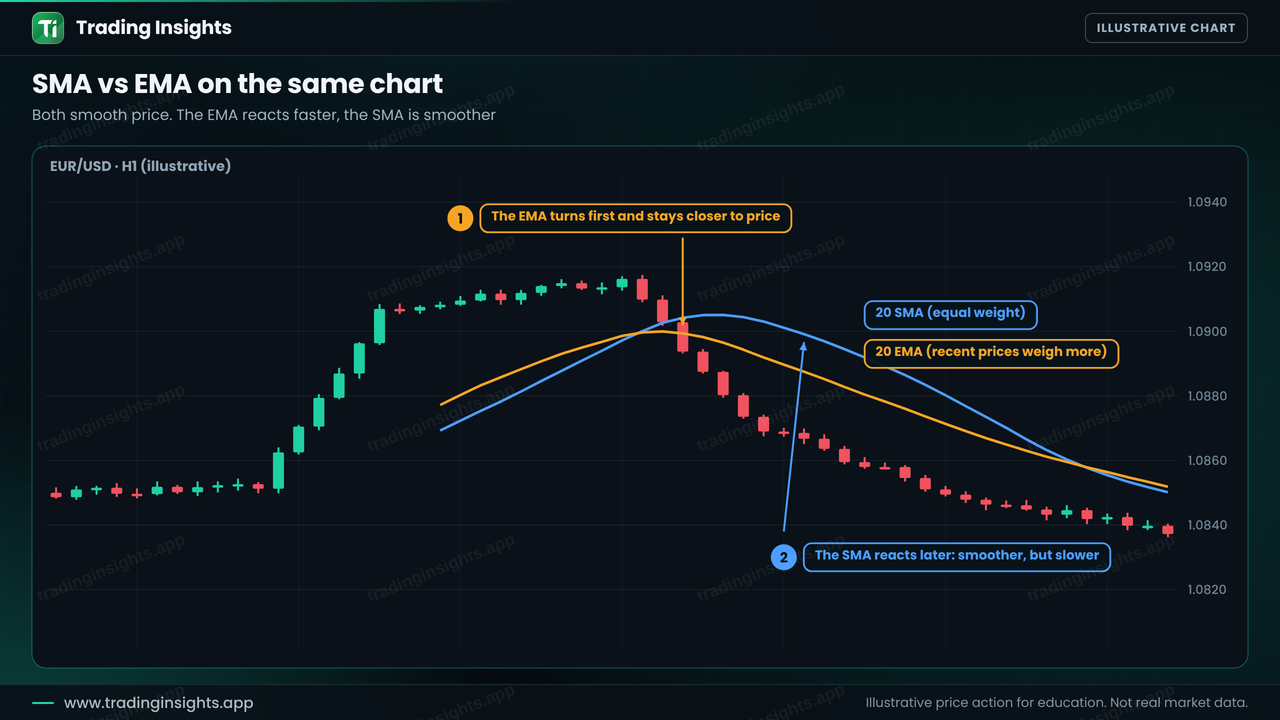
- Exponential moving average (EMA): gives more weight to recent candles. Each new value is the latest close times a multiplier, plus the previous EMA times (1 minus the multiplier). The multiplier is 2 / (N + 1), which is about 0.095 for a 20-period EMA.
The practical effect is that the EMA turns sooner after a change in direction and stays closer to price, while the SMA is smoother but slower.
| SMA | EMA | |
|---|---|---|
| Weighting | All candles equal | Recent candles weigh more |
| Speed | Slower | Faster |
| Smoothness | Smoother | More reactive, more false signals in ranges |
| Common use | Long-term trend (50, 100, 200) | Short-term trend and pullbacks (9, 20, 50) |
Neither is better. The right choice depends on how quickly you want the line to react compared with how many false signals you can tolerate.
Moving average crossovers
A crossover happens when a fast average crosses a slow one. When the fast line crosses above the slow line, it is read as a bullish signal. When it crosses below, it is read as bearish. A well-known version uses the 50 and 200 period averages: a bullish cross is often called a golden cross and a bearish one a death cross.
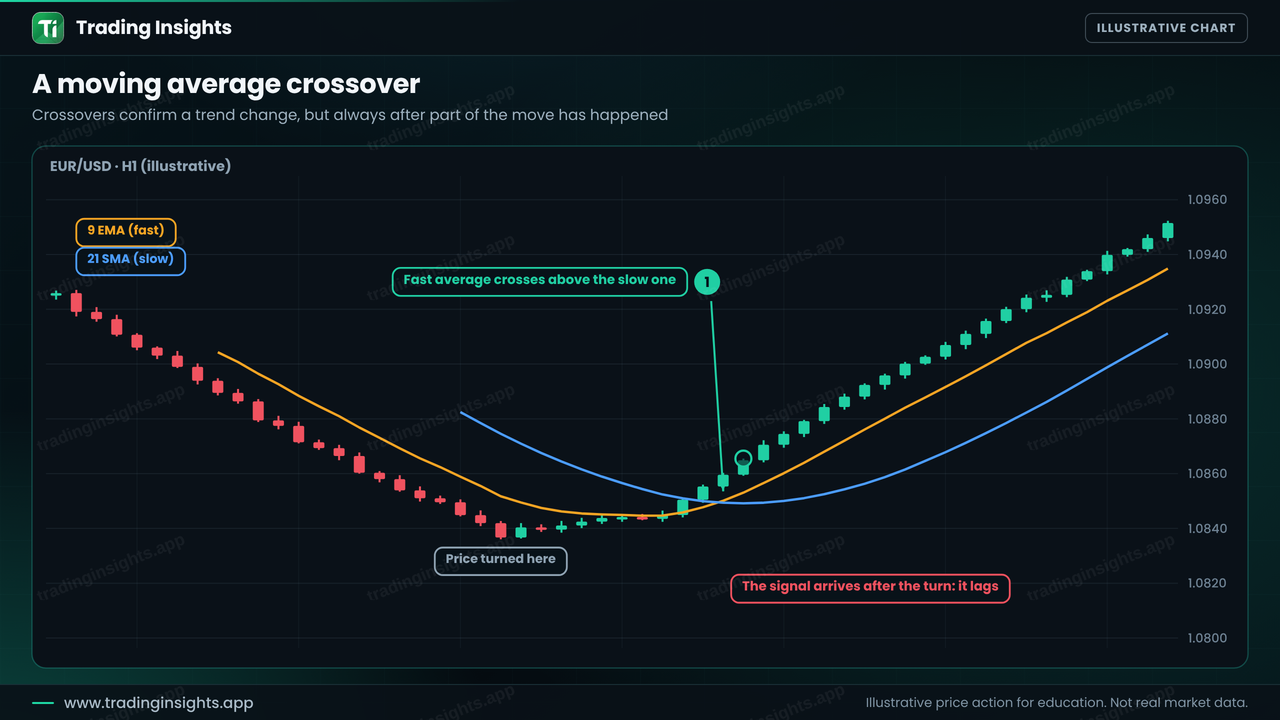
The key limitation is lag. A moving average is built from past prices, so every crossover comes after price has already turned. In a trending market this is acceptable, but in a sideways market the lines cross back and forth and produce a series of losing signals. If you use crossovers, use them as a filter for direction and not as a stand-alone entry. To spot an early change of direction from price itself, see what a change of character is.
Trading a pullback to a moving average
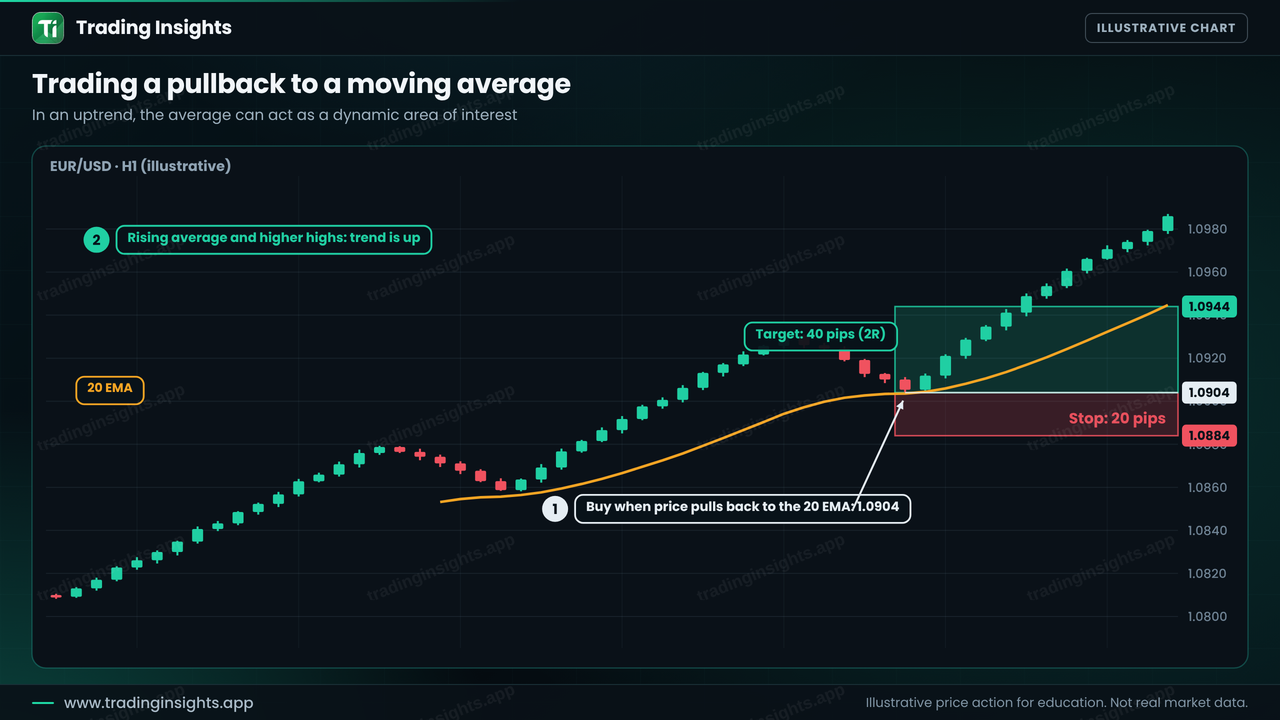
A more common use is as a moving area of interest. In a healthy uptrend, price often pulls back to a rising average and then continues, so many traders watch the 20 or 50 EMA for a bounce.
Here is an illustrative plan on EUR/USD, H1. The 20 EMA is rising and price is making higher highs. Price pulls back to the average, and you buy the reaction.