Every trade plan needs three prices decided before you enter: where to get in, where you are wrong, and where you take profit. Price action gives you a way to find all three from the chart itself, without lagging indicators. The idea is simple. The entry comes from a reaction at a level, the stop goes beyond the level that proves the idea wrong, and the target sits at the next area where price is likely to react. This guide walks through each part with a long trade and a short trade, then shows why a tight stop often fails.
Start with the level, not the entry
Beginners often look for an entry first and then guess where the stop should go. It works better the other way round. Find the level first, such as a support zone where price has bounced twice or a resistance zone that has rejected price several times. These areas are where decisions are made, so they give you a logical place to enter and a logical place to be wrong. If you are not sure how to draw these zones, read support and resistance vs supply and demand zones.
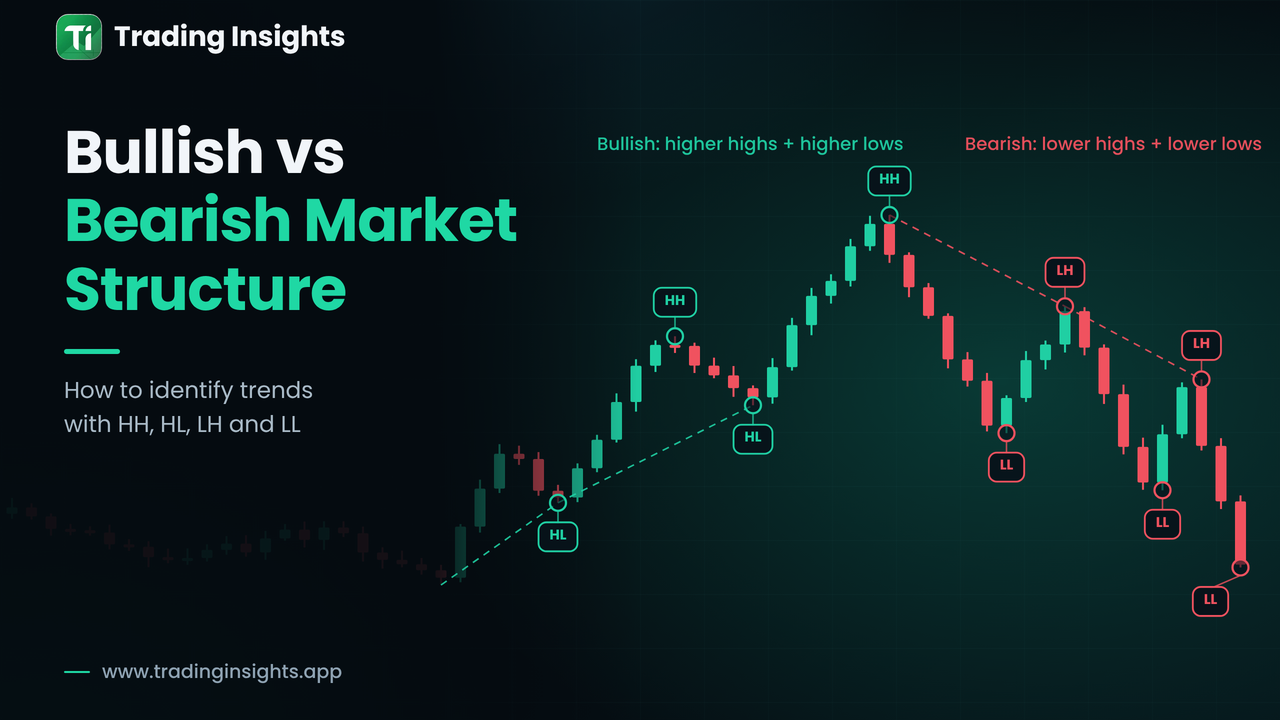
Also check the bigger picture. A long trade at support has a better chance when the higher timeframe is bullish. Market structure and bullish vs bearish structure explain how to read this.
Step 1: Entry. Wait for a reaction signal
Price touching a level is not a signal by itself. You want to see the market react. Two simple signals are:
Pin bar: a candle with a long wick into the level and a small body, showing that price was rejected.
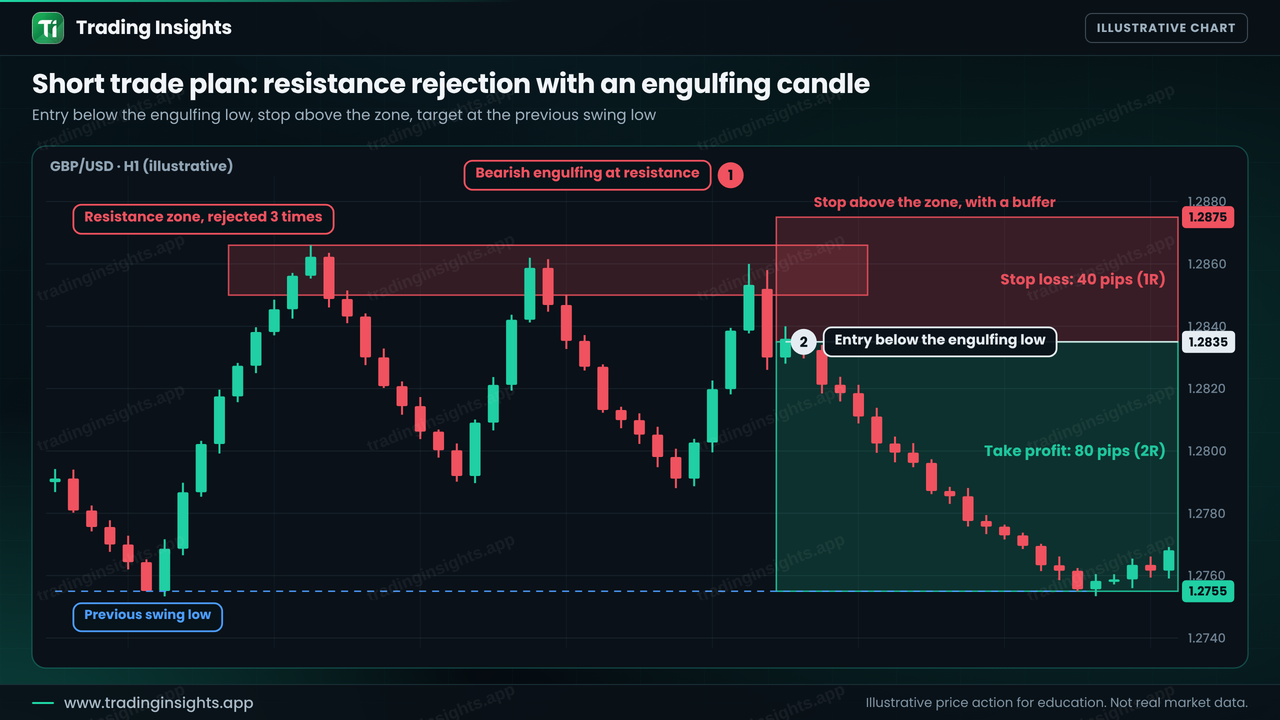
Engulfing candle: a candle whose body covers the previous candle's body, showing a change in momentum.
The entry is placed just beyond the signal candle, so that the market has to confirm the idea before you are in. For a long trade, that is above the pin bar high. For a short trade, it is below the engulfing candle's low. The cost of this method is a slightly worse entry price. The benefit is that you skip many failed touches.
Long trade example: support retest with a pin bar
On EUR/USD H4, price tests a support zone twice and bounces. On the third visit a bullish pin bar forms with a long lower wick into the zone. The plan is below.
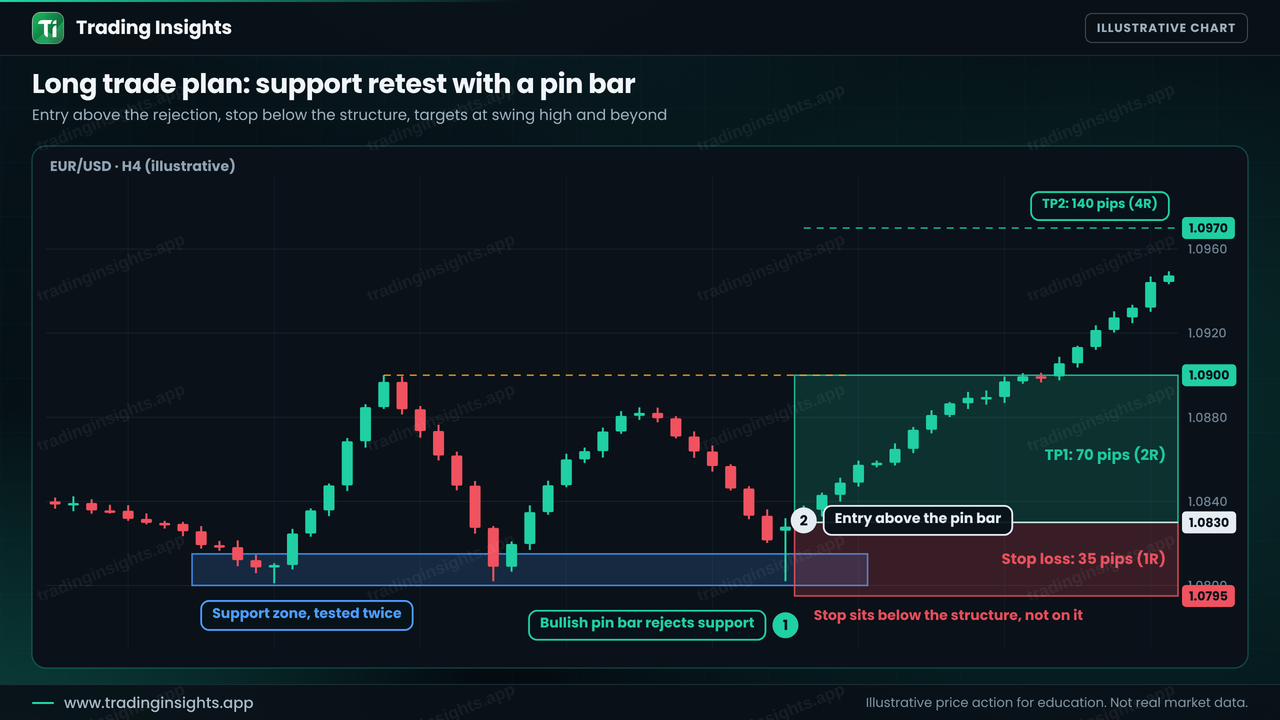
Figure 1: A long trade from support. Entry above the pin bar, stop below the zone, and two targets.
Entry: 1.0830, just above the pin bar high.
Stop loss: 1.0795, below the support structure (35 pips).
Take profit 1: 1.0900, the previous swing high (70 pips, 2R).
Take profit 2: 1.0970, the next resistance (140 pips, 4R).
Many traders close half the position at the first target and move the stop to break-even for the rest, but this is a style choice, and you should test it before relying on it.
Step 2: Stop loss. Place it where the idea is wrong
A stop loss is not a number you pick from your budget. It is the price at which your trade idea no longer makes sense. If you buy at support, the idea fails when price closes clearly below support, so the stop goes below the zone, with a small buffer for spread and noise. Then you size the position from that distance, not the other way round.
Stop placement: tight vs structure-based
A very tight stop feels safe because the loss is small, but it often sits inside normal price noise. In the example below, the entry is the same and the price path is the same. With an 8-pip stop, a normal pullback hits the stop and price then reaches the target without you. With a stop below the swing low, the trade survives.
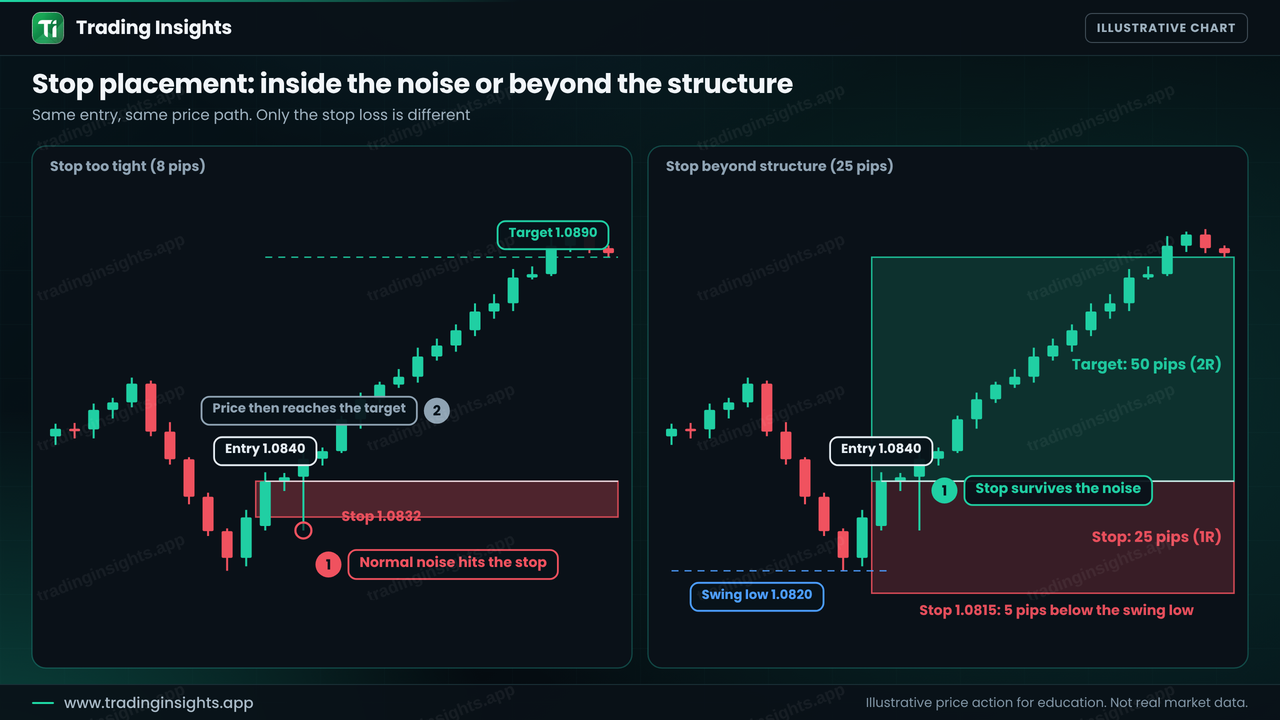
Figure 2: Same entry, same price path. The 8-pip stop is hit by noise. The 25-pip stop below the swing low survives and the trade reaches its target.