A valid fair value gap is a three-candle gap, measured wick to wick, that is created by a strong displacement move, ideally breaks structure and appears in a sensible context. Plenty of gaps appear on a chart, and most are noise. The seven rules below help you filter for the ones worth tracking. For the basic definition, start with our fair value gap (FVG) explained guide.
The anatomy of a fair value gap
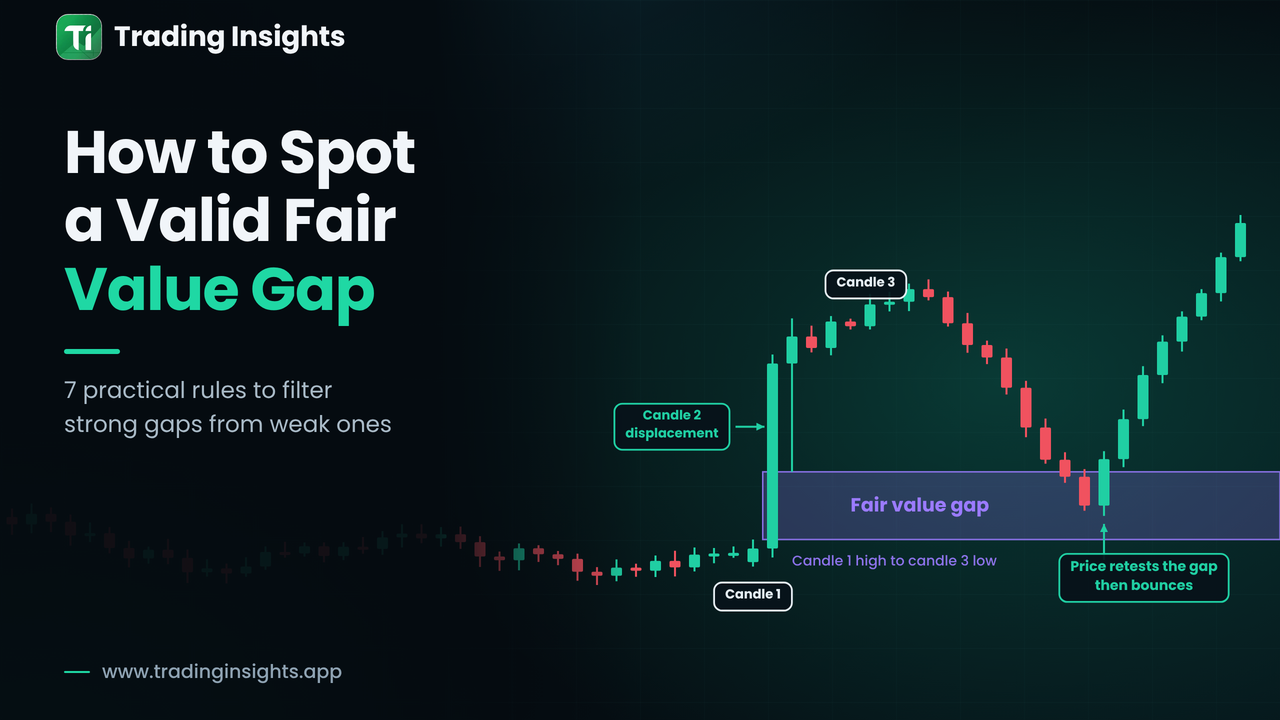
A bullish fair value gap involves three consecutive candles. The first candle's high and the third candle's low do not overlap, so a gap is left on the chart. The middle candle is usually a large, strong candle that created the move. The gap is measured from the first candle's high to the third candle's low. A bearish gap is the same idea in reverse.
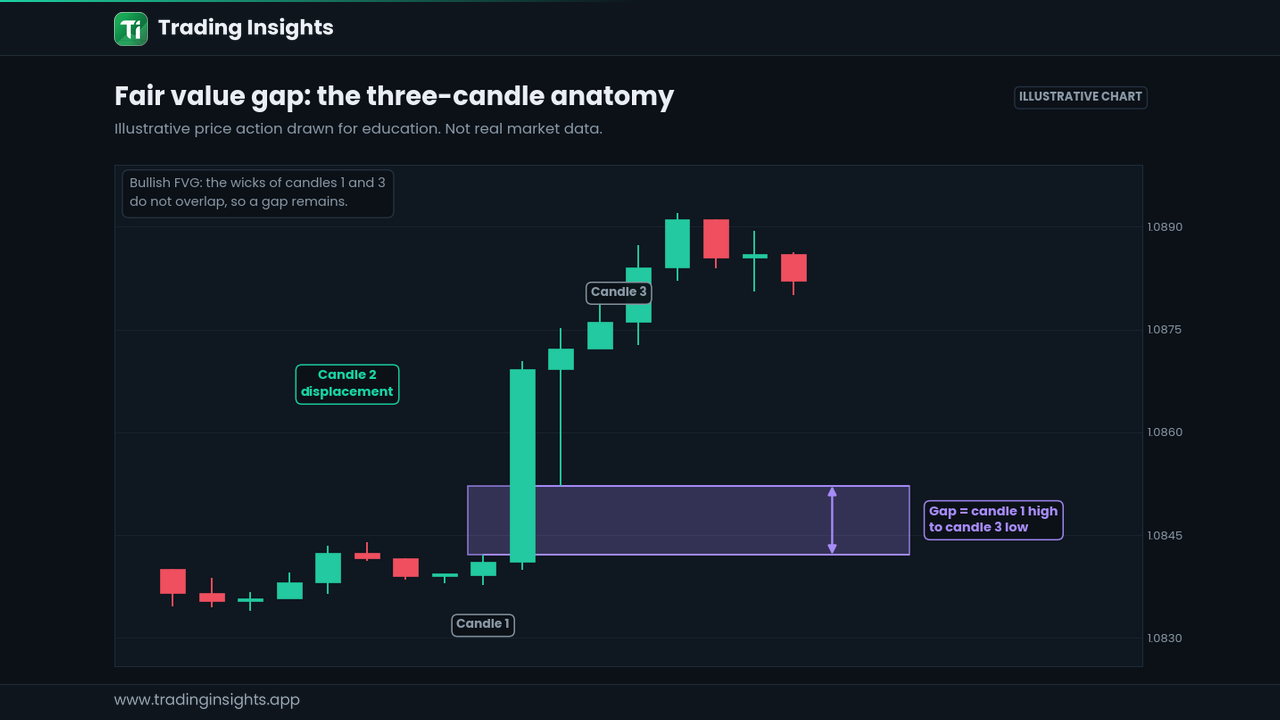
Figure 1: The gap runs from the high of candle 1 to the low of candle 3.
Rule 1: The gap must be wick to wick
Measure from the first candle's high to the third candle's low (bullish) or the first candle's low to the third candle's high (bearish). If the wicks overlap, there is no gap. Some tools draw gaps from bodies, which can mislead you into marking overlaps as imbalances. Use wicks as your default and check the tool you use.
Rule 2: The middle candle shows displacement
A gap created by a small candle in a quiet market tells you very little. The middle candle should be large relative to recent candles, with small wicks and a close near its extreme. How to measure this is covered in what a displacement candle is.
Rule 3: The gap is meaningful in size
A gap that is a few ticks wide is easily filled by normal movement. Compare the gap height with the average true range (ATR) of recent candles. A reasonable starting point is to ignore gaps that are small compared with ATR, for example under roughly a quarter of it. This threshold is a guideline to test, not a law.
Rule 4: It comes with a break of structure
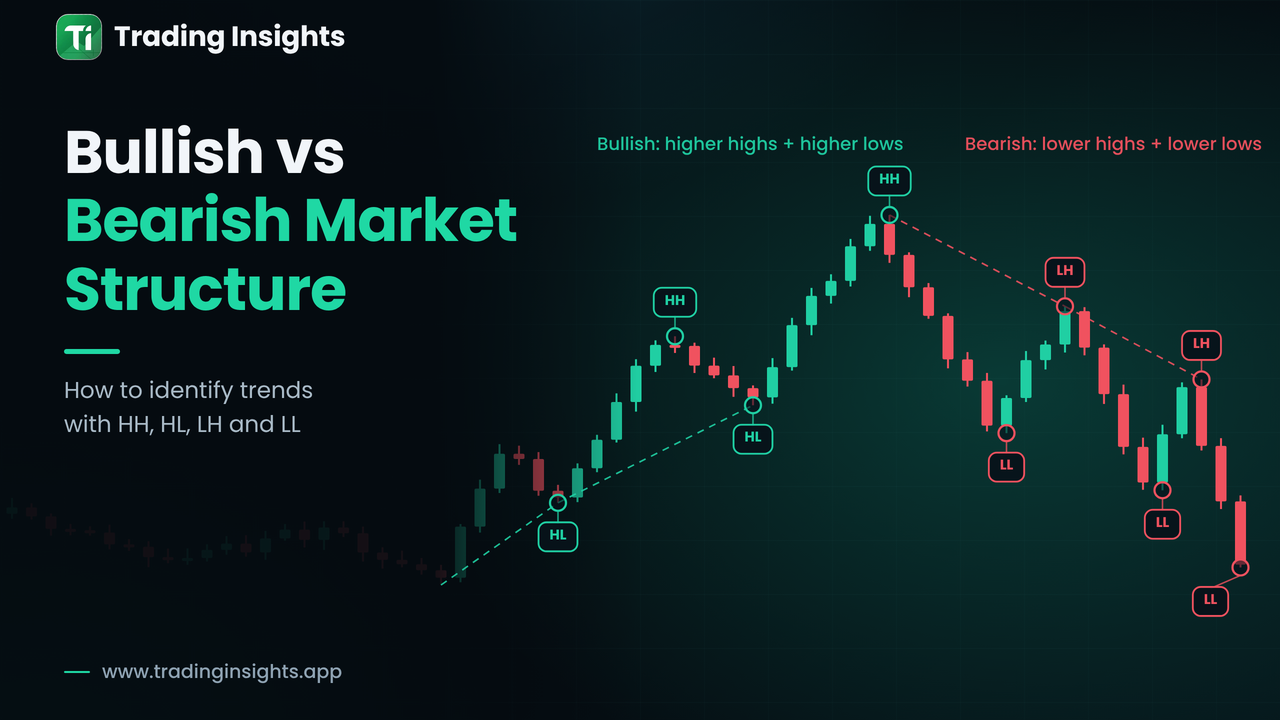
A gap that forms during a move that also breaks a swing high or low has more context than one that appears in the middle of a range. The break shows that the move had enough power to change the picture. If you want to refresh the terms, read what market structure is. The chart below combines rules 1 to 4.
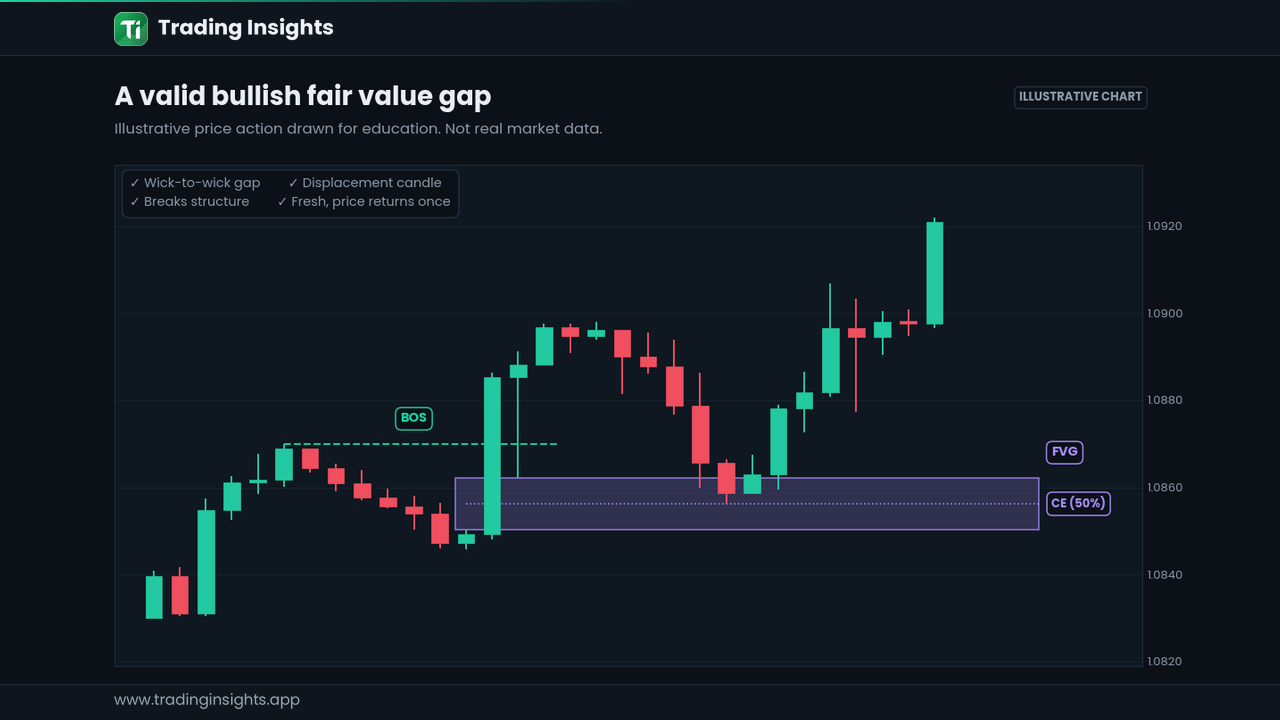
Figure 2: A valid gap. Wick-to-wick, displacement, a break of structure and a clear zone.
Rule 5: The context supports it
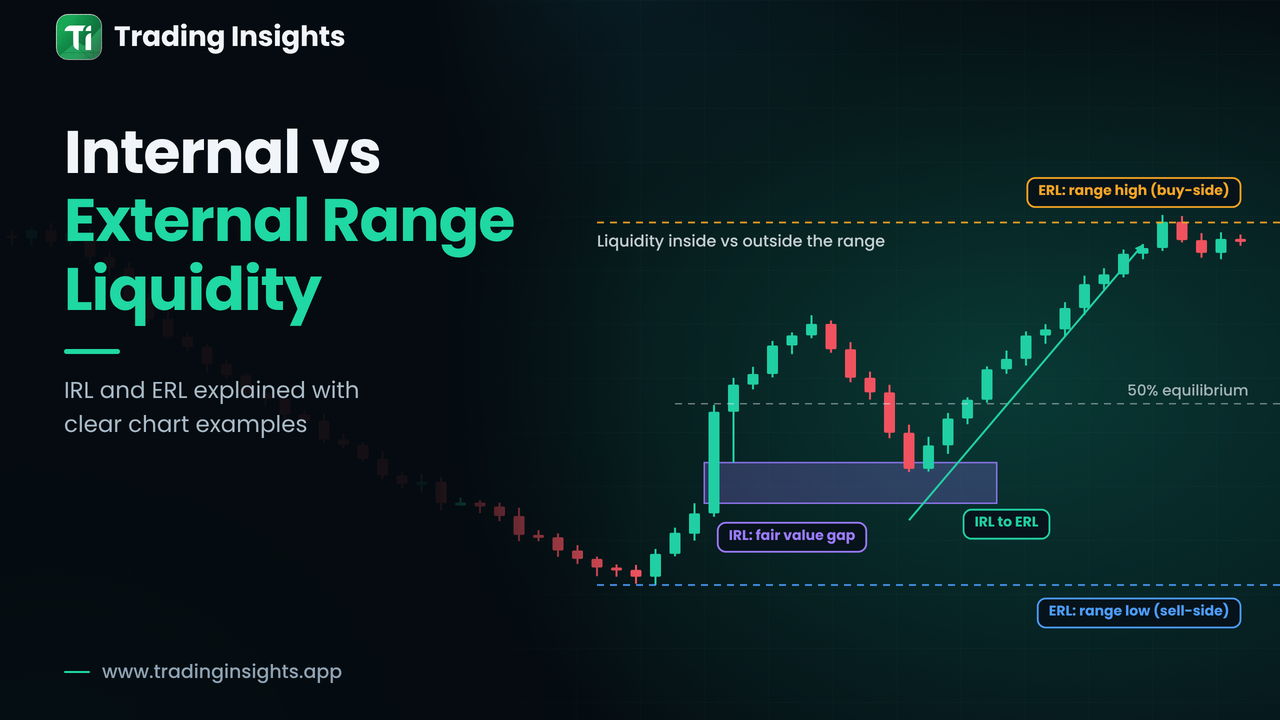
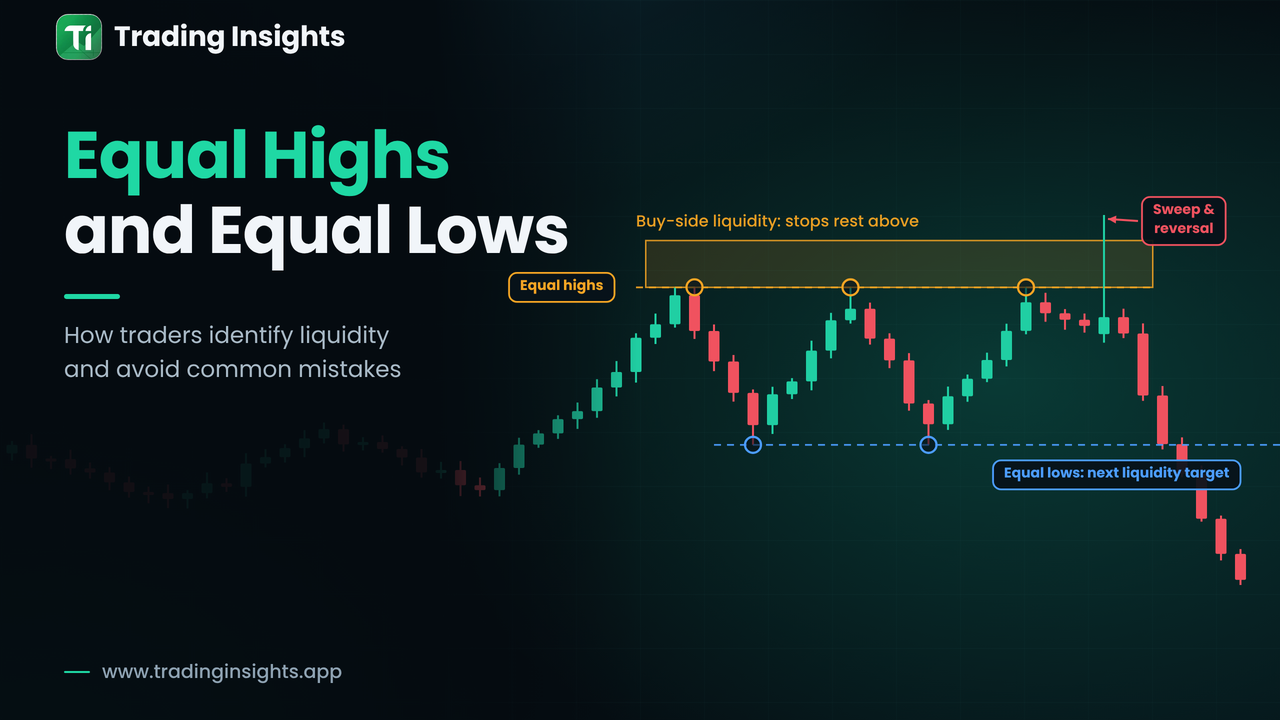
Ask where the gap sits. Does it agree with the higher-timeframe direction? Did it form after a liquidity sweep, such as a swept equal low? Is it inside a larger range or in free space? A bullish gap in a bullish structure is easier to justify than one fighting a strong downtrend. This is the same logic as in bullish vs bearish market structure.
Rule 6: The gap is still fresh
A gap is most relevant before price has returned to it. After price trades completely through the gap, or closes beyond it, many traders consider it filled or inverted. Partial returns are common, and some traders look at the 50% level, known as the consequent encroachment (CE), as a reference. The next chart shows a bearish gap, retested at its midpoint.
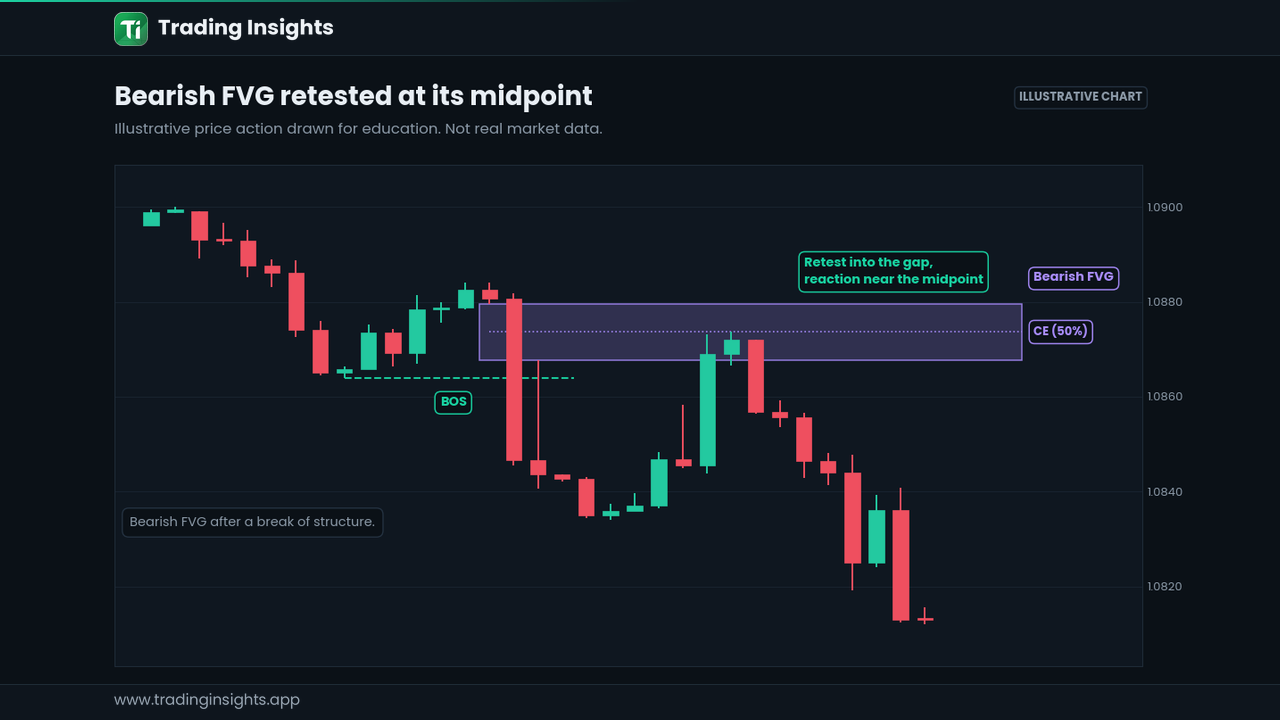
Figure 3: A bearish gap retested near its midpoint (CE) before the next leg lower.
Rule 7: You have a plan with defined risk
A valid gap is not a signal. It is an area of interest. Before acting, decide what confirmation you need, where your idea is wrong and how much you are willing to risk. A gap with no plan is only a coloured rectangle. Remember that gaps also work together with other zones: a gap that overlaps an order block offers more detail to work with than one standing alone.
What an invalid gap looks like
The chart below shows a gap that fails most of the rules. The middle candle is small, there is no break of structure, the gap is tiny relative to normal candles and price fills it within a few candles. Gaps like this are best ignored.
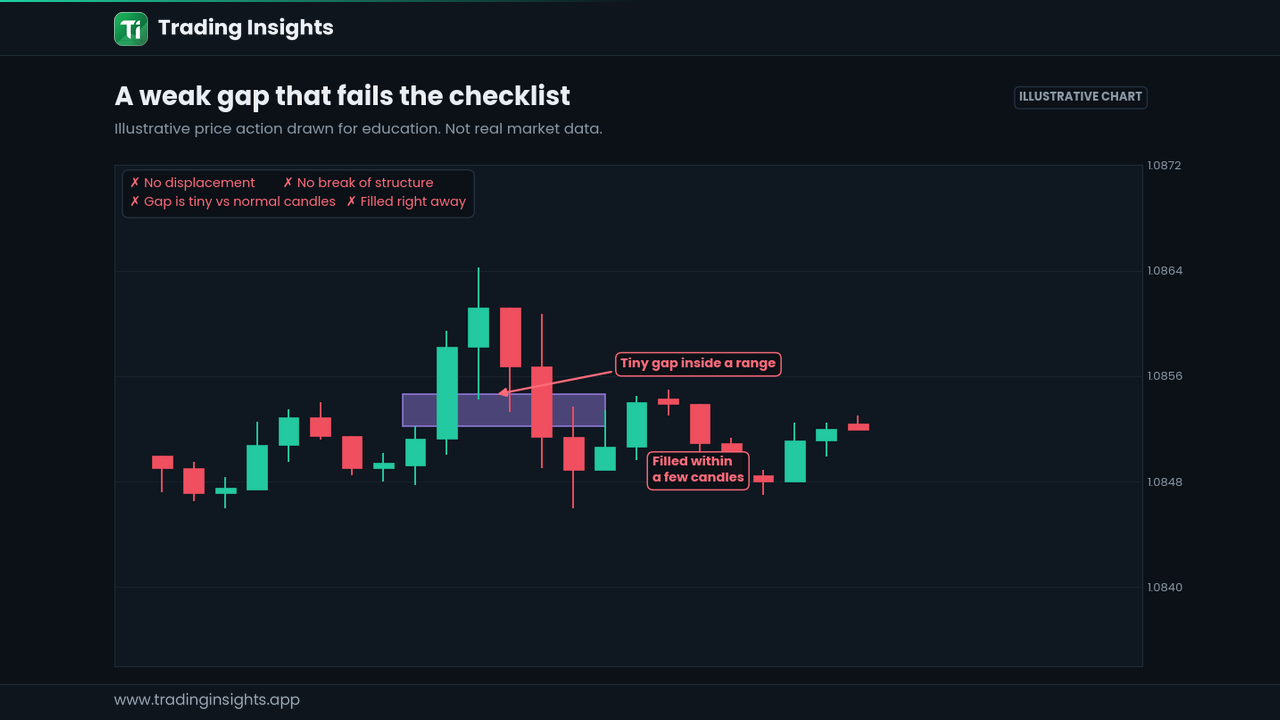
Figure 4: A weak gap inside a range. It fails the checklist and is filled almost immediately.
The 7-rule checklist
# | Rule | Quick test |
|---|---|---|
1 | Wick-to-wick gap | Candle 1 and candle 3 wicks do not overlap |
2 | Displacement candle | Body much larger than recent candles |
3 | Meaningful size | Gap is not tiny relative to ATR |
4 | Break of structure | A swing was broken by a close |
5 | Supportive context | Agrees with higher-timeframe direction or follows a sweep |
6 | Still fresh | Price has not closed through the gap |
7 | Plan with risk | Confirmation, invalidation and size are decided |
No gap will tick every box every time. Treat the list as a way to rank gaps, not as a pass or fail exam.
Common mistakes
Marking every three-candle gap on the chart.
Drawing gaps from candle bodies and then trading overlaps.
Ignoring that a close through the entire gap generally invalidates it.
Entering at the first touch with no confirmation and no stop.
Frequently asked questions
Does a valid FVG always get filled?
Many gaps are revisited, but not all, and the depth of the return varies. Never assume a fill.
What is the best timeframe for fair value gaps?
Gaps on higher timeframes such as H4 or Daily tend to carry more weight. Lower-timeframe gaps can refine entries within a higher-timeframe idea.
What happens when a gap is invalidated?
If price closes through the whole gap, many traders treat it as failed and sometimes watch it from the other side as an inverse gap.
This article is for education only and is not financial advice. Trading carries risk, and no checklist guarantees results.