Practical, step-by-step strategies and market insight from our trading desk — written to be read, tested on a demo account, then applied with live signals in the app.
 Price Action
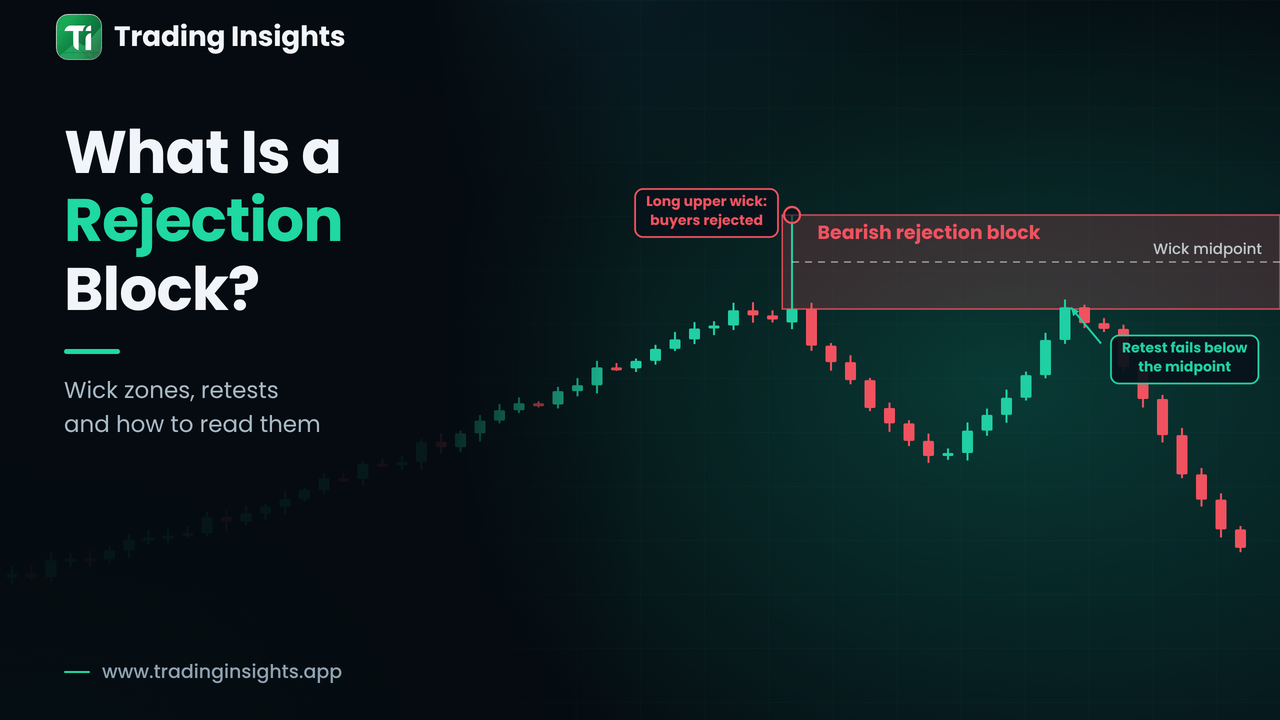
A rejection block is the wick zone of a swing candle that shows price was pushed back. Learn how to mark bullish and bearish blocks and read the retest.
Read more →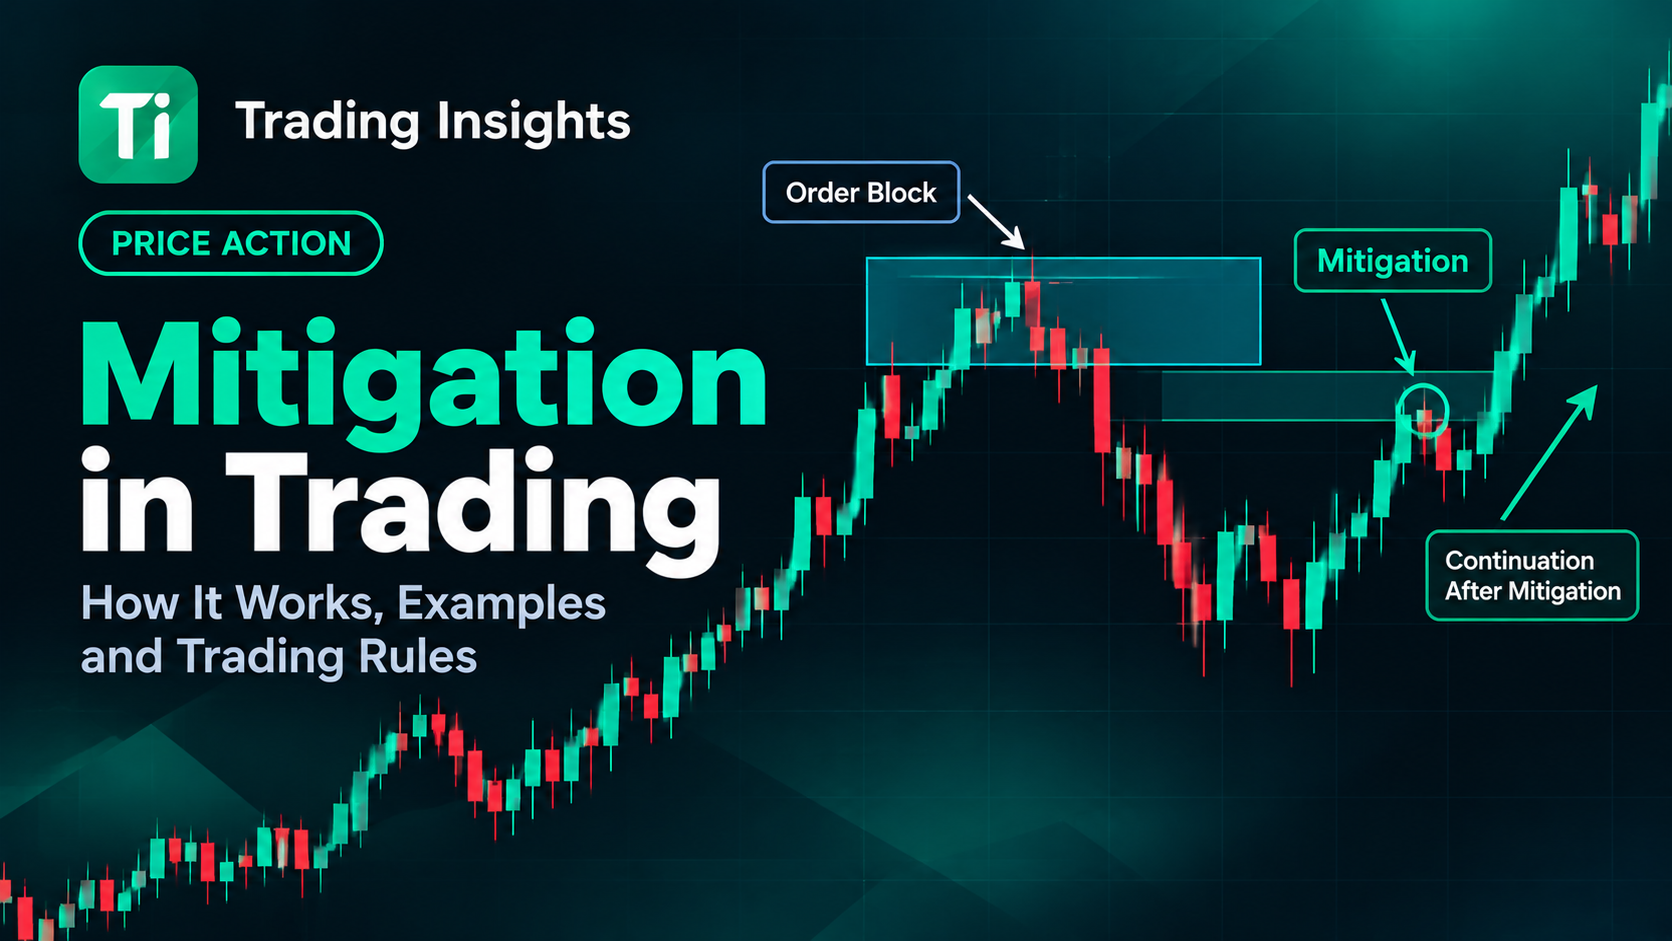 Price Action
Learn what mitigation means in price-action discussions and how to analyze revisited zones without assuming they must hold.
Read more →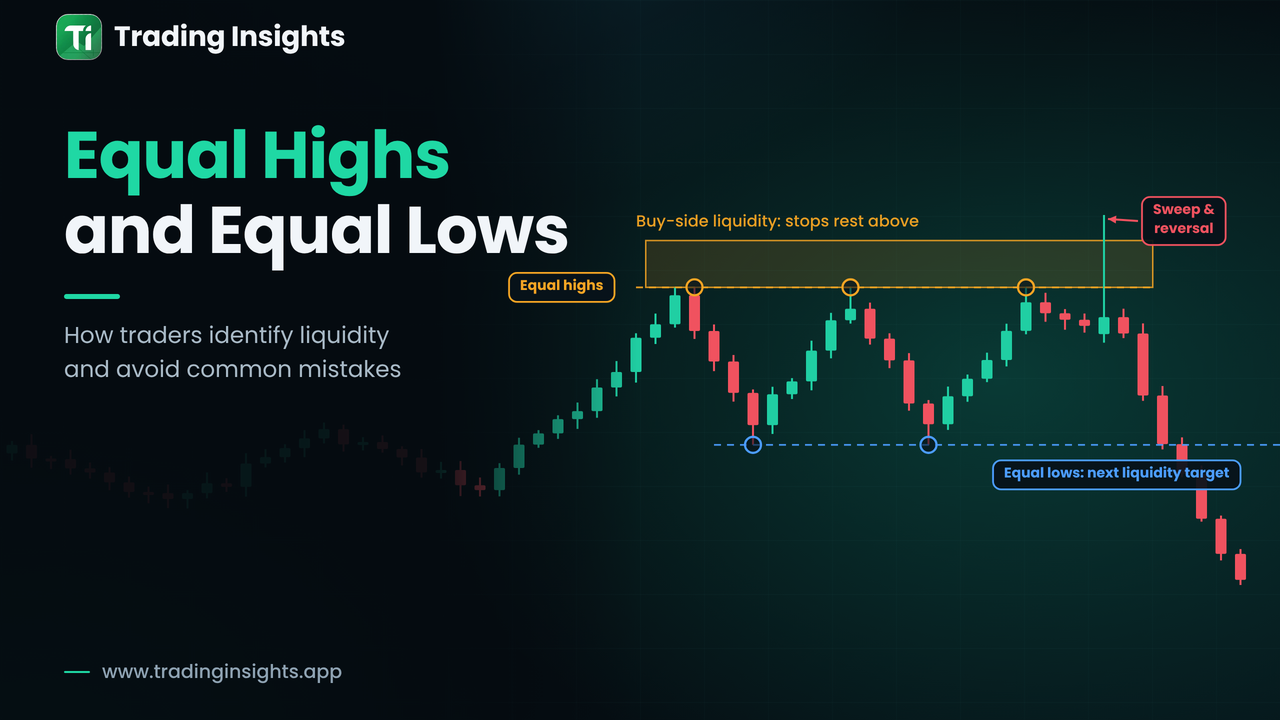 Price Action
Equal highs and equal lows are repeated swing points at nearly the same price. Learn how to mark them, why they attract orders and how to read what happens next.
Read more →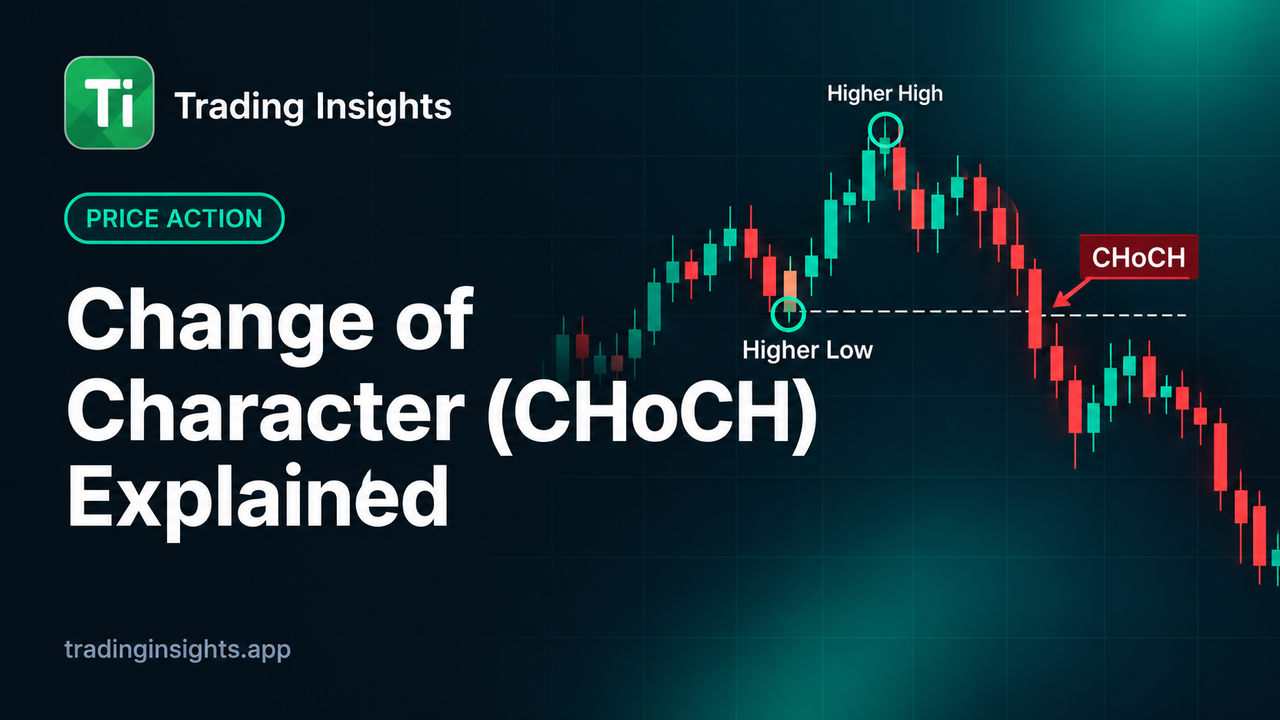 Price Action
Learn how traders use CHoCH as an early warning of a possible shift in market direction and what confirmation to look for next.
Read more →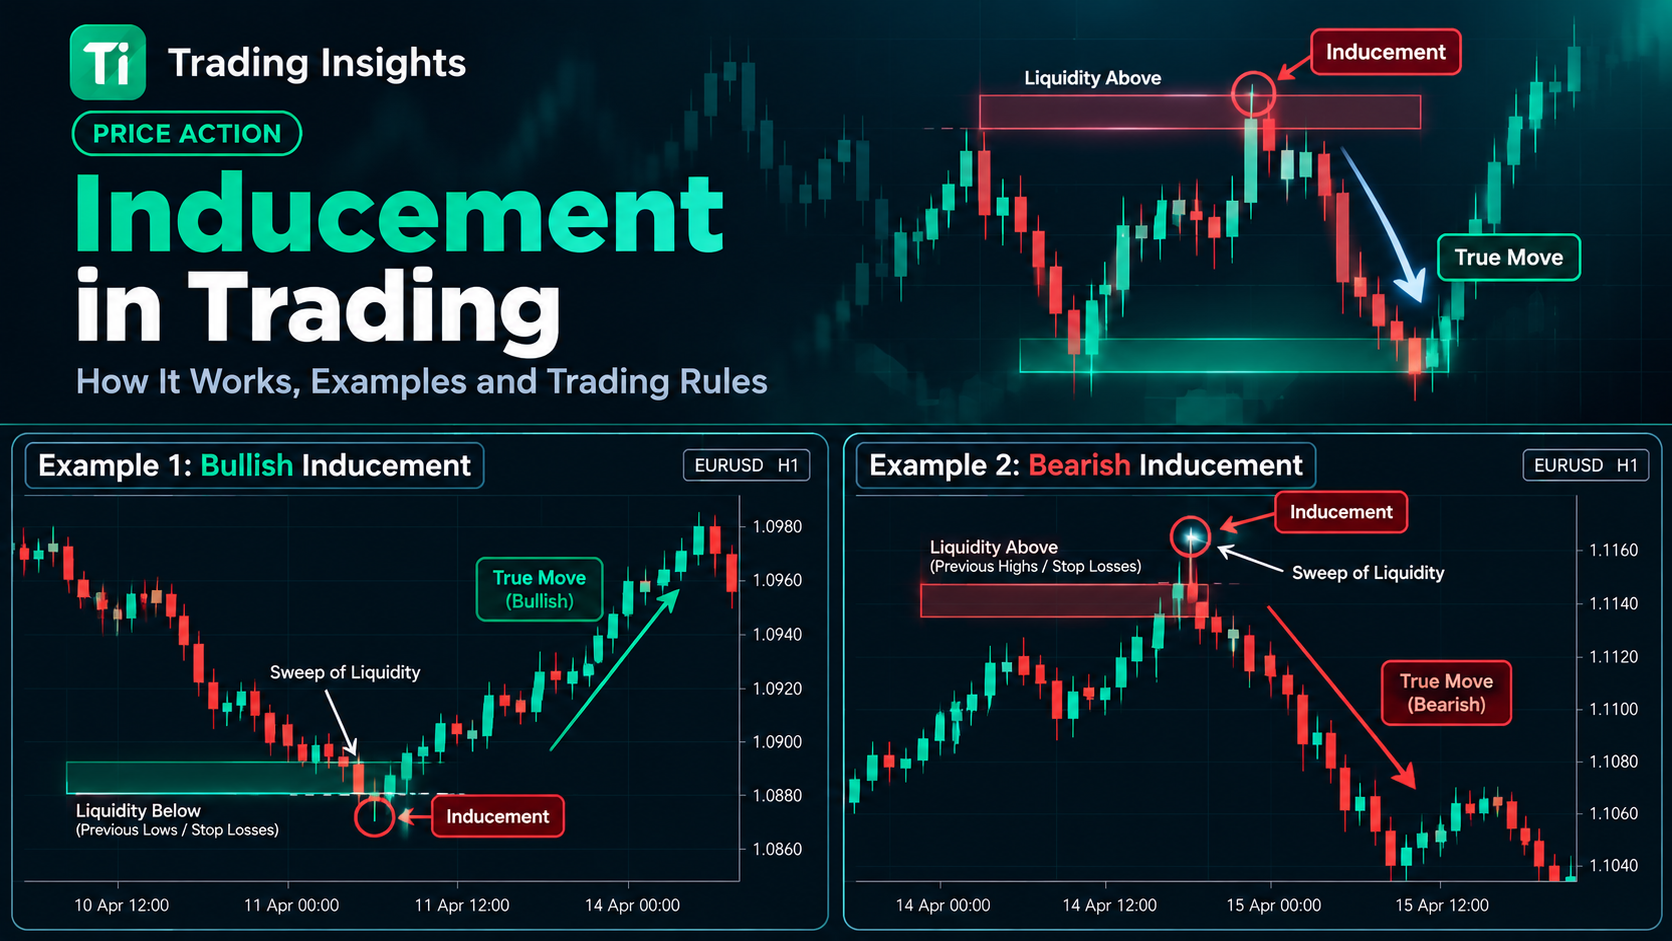 Price Action
A balanced explanation of inducement, minor swing levels, liquidity context, and practical ways to make the idea testable.
Read more →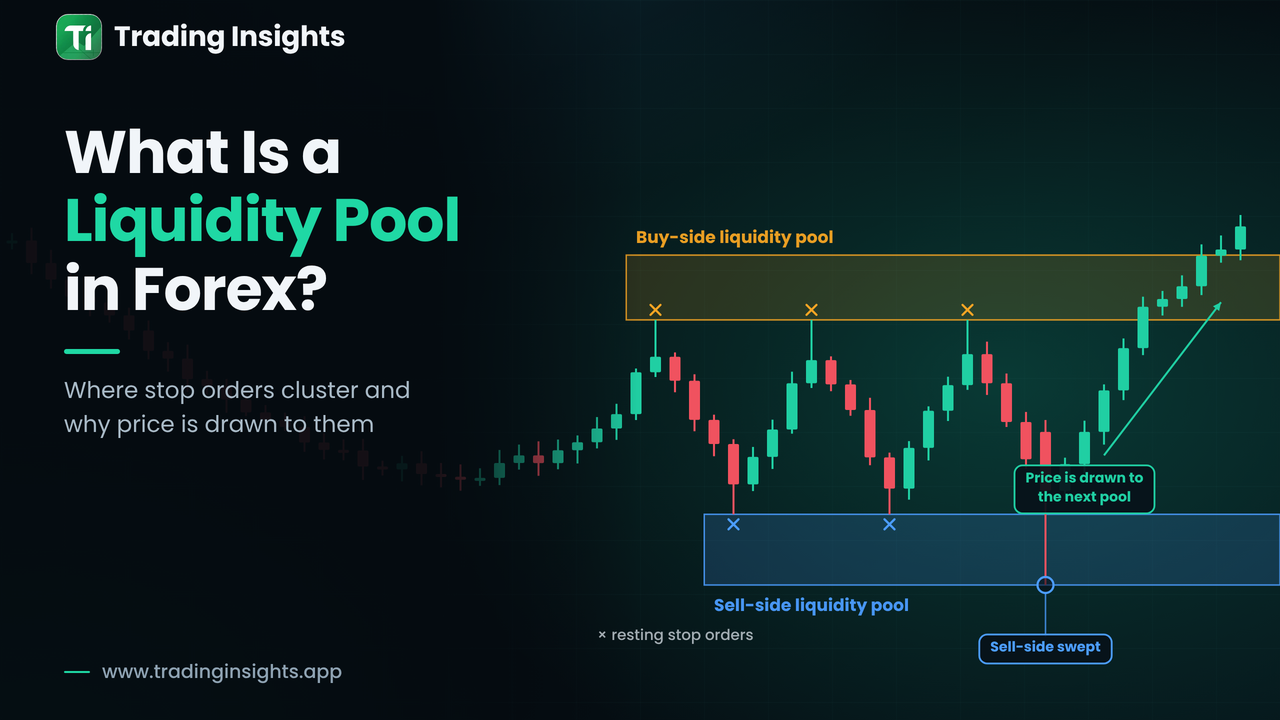 Price Action
A liquidity pool is a cluster of resting orders behind obvious highs and lows. Learn where pools form, what a sweep looks like and how to use the idea carefully.
Read more →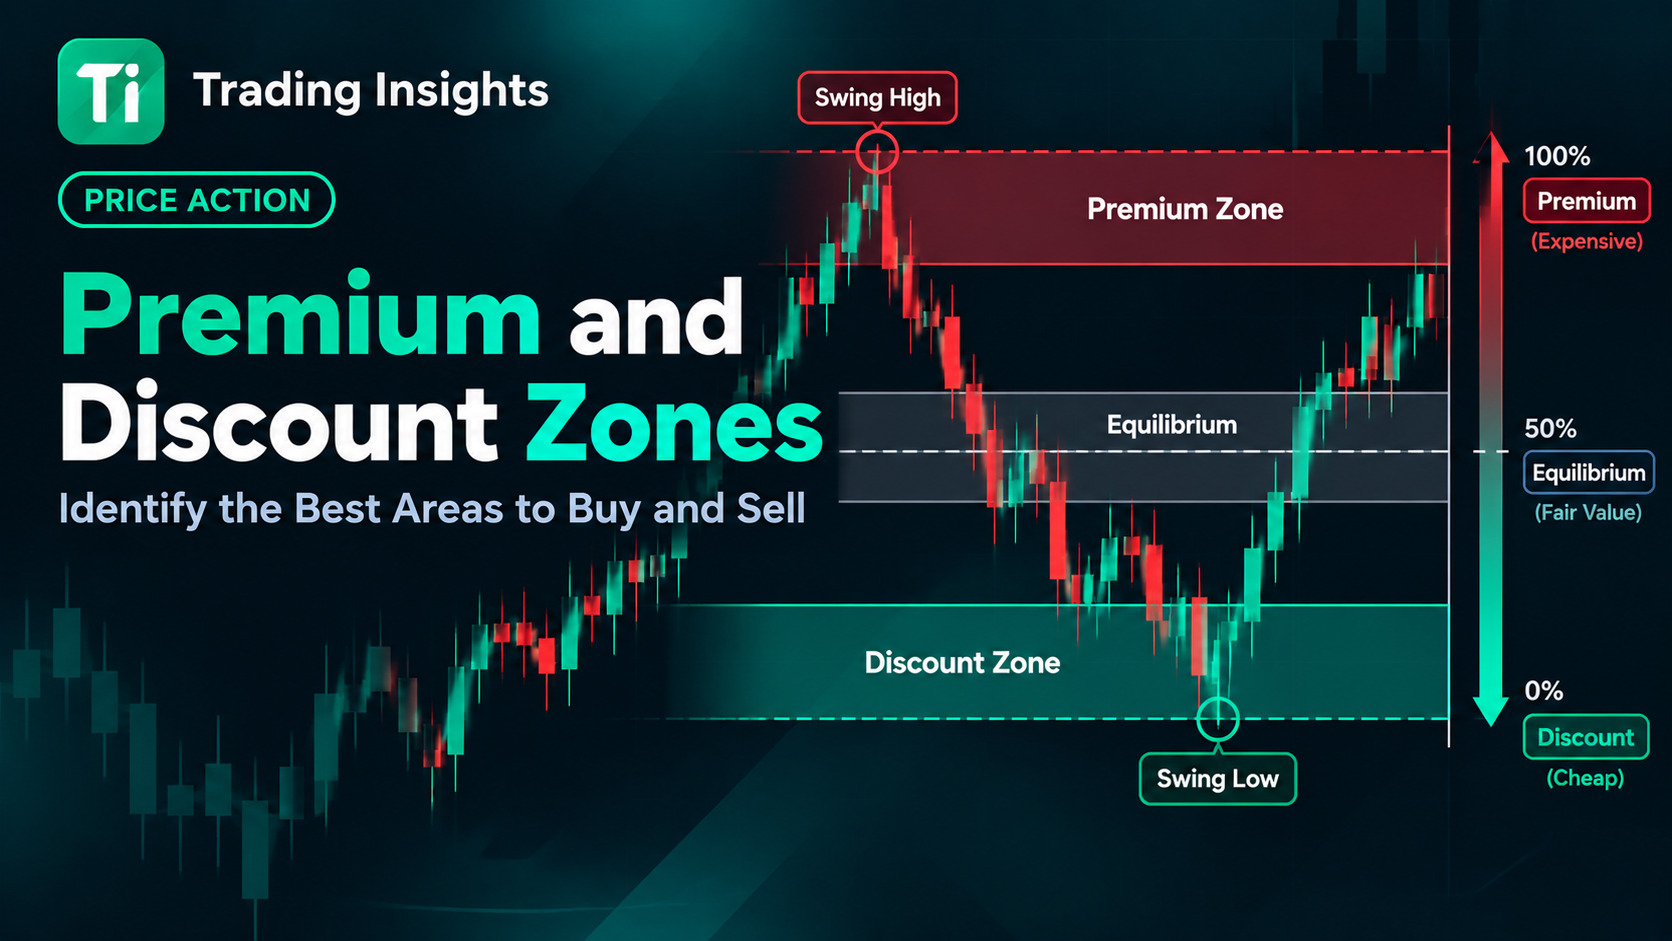 Price Action
Learn how the midpoint of a defined range is used to describe premium and discount, plus common interpretation mistakes.
Read more →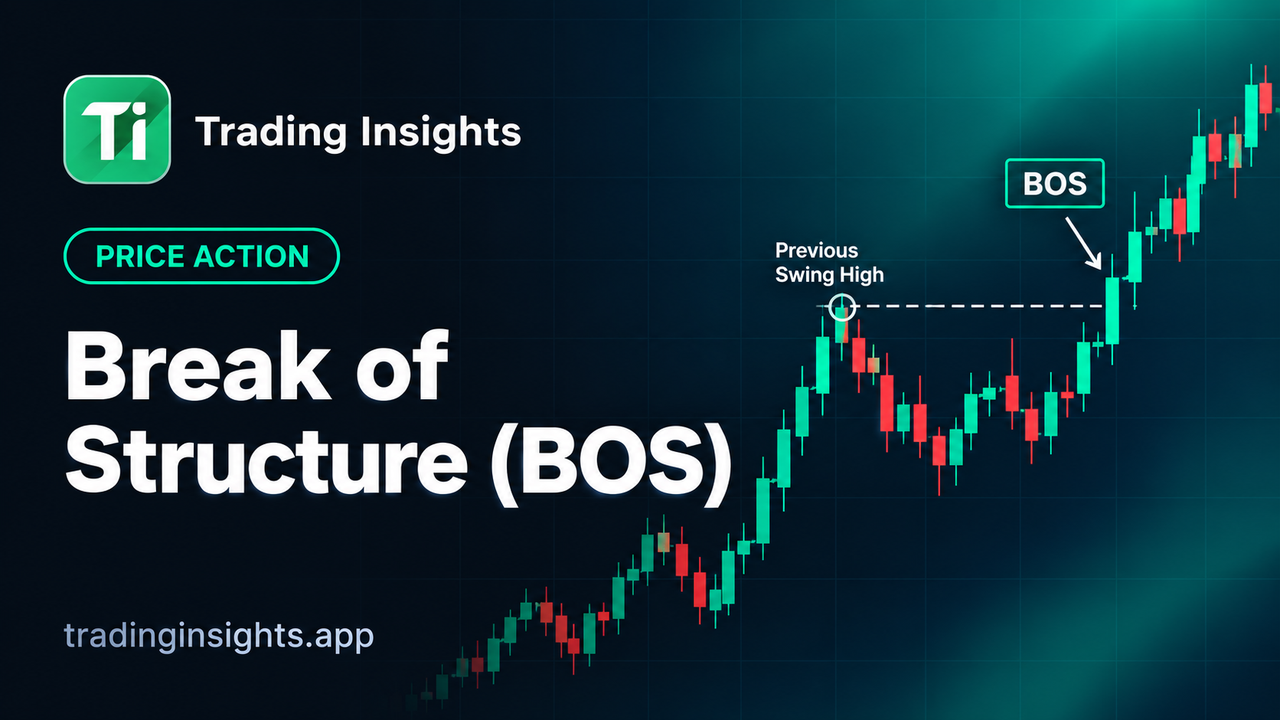 Price Action
A practical guide to identifying a Break of Structure, confirming the break, and avoiding common market-structure mistakes.
Read more →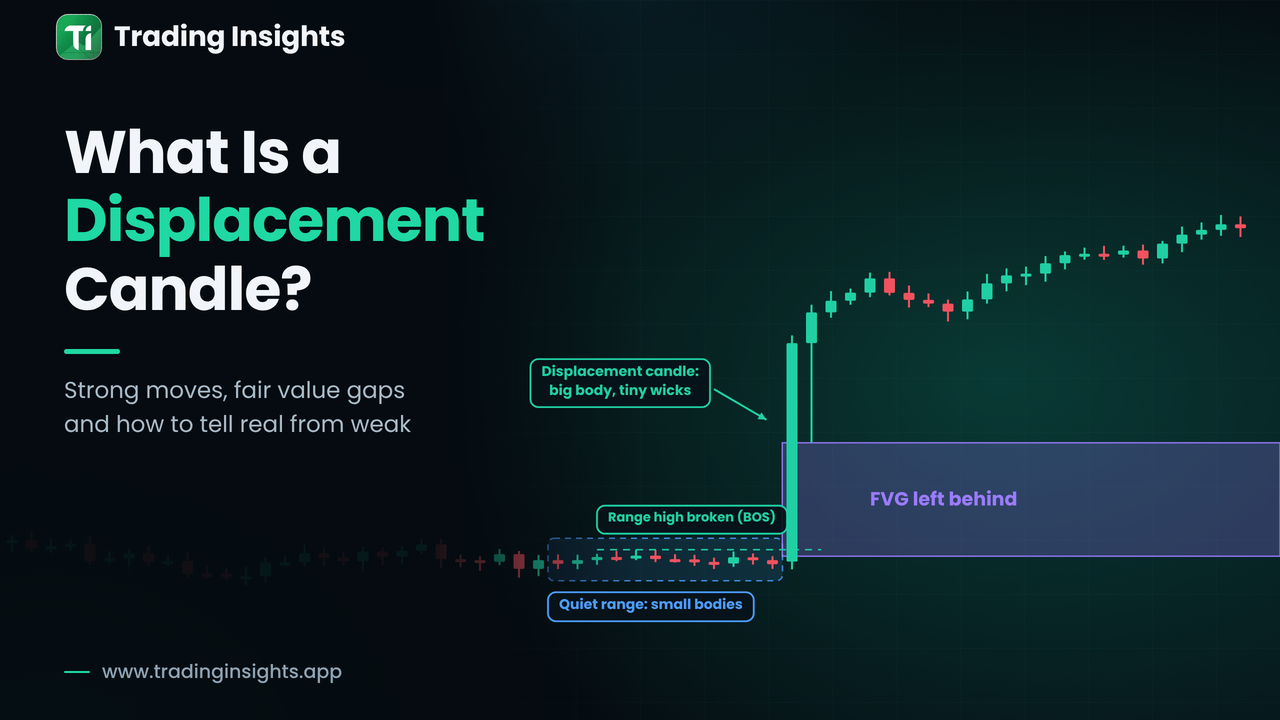 Price Action
A displacement candle is a strong, fast, one-sided move with a large body. Learn how to measure it, how it links to FVGs and BOS, and how it differs from a weak break.
Read more →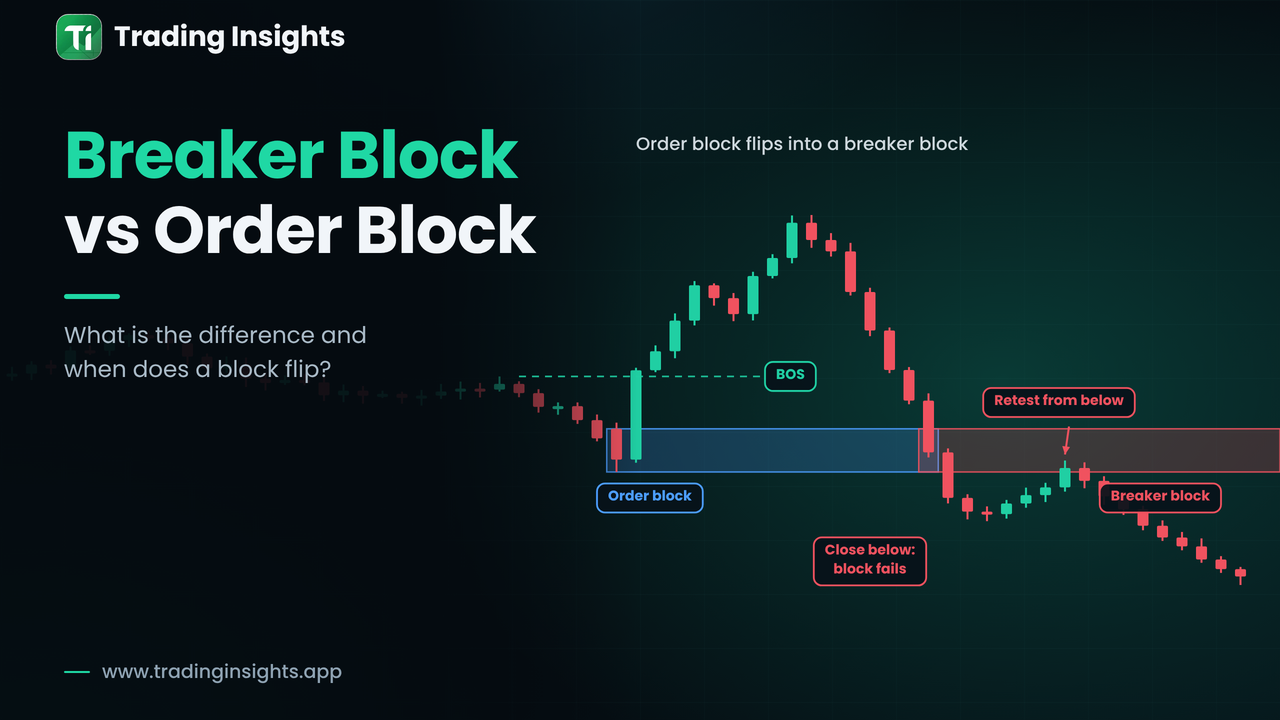 Price Action
An order block is a zone left by a move that broke structure. A breaker block is an order block that failed and now acts from the other side. See both on charts.
Read more →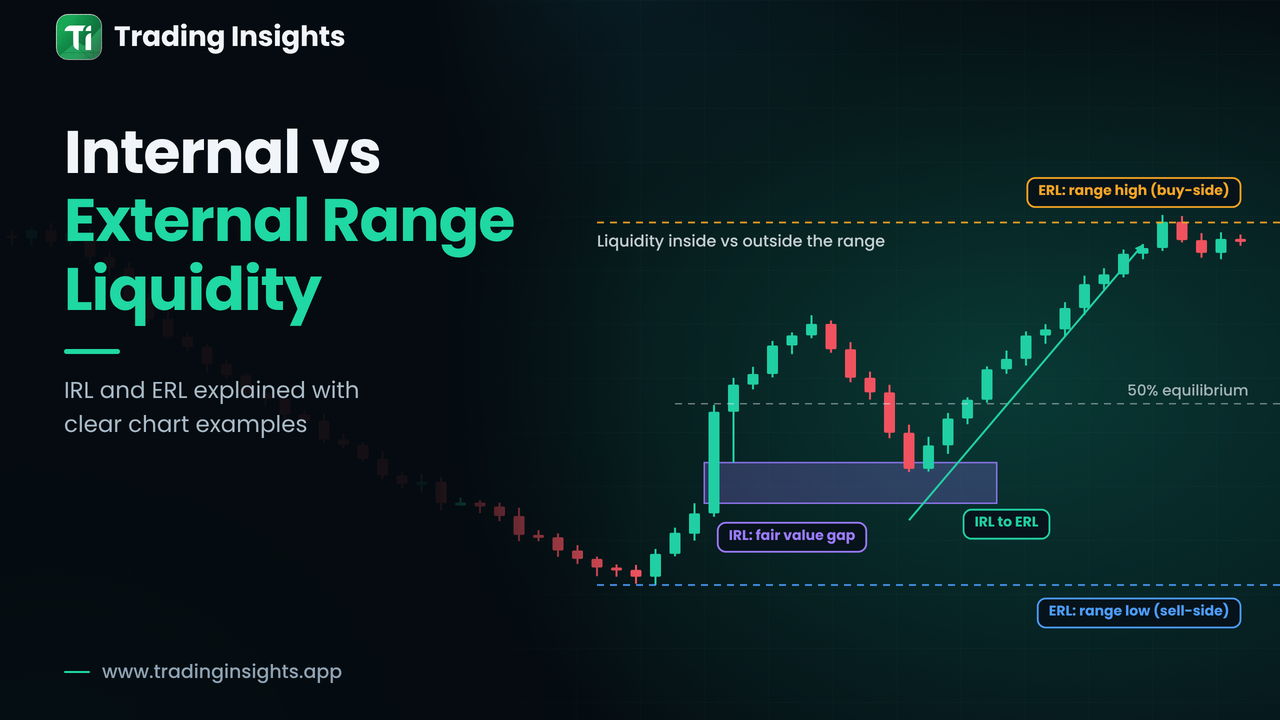 Price Action
External range liquidity sits beyond the range high and low; internal range liquidity sits inside. See how the two differ and how to map them on a chart.
Read more →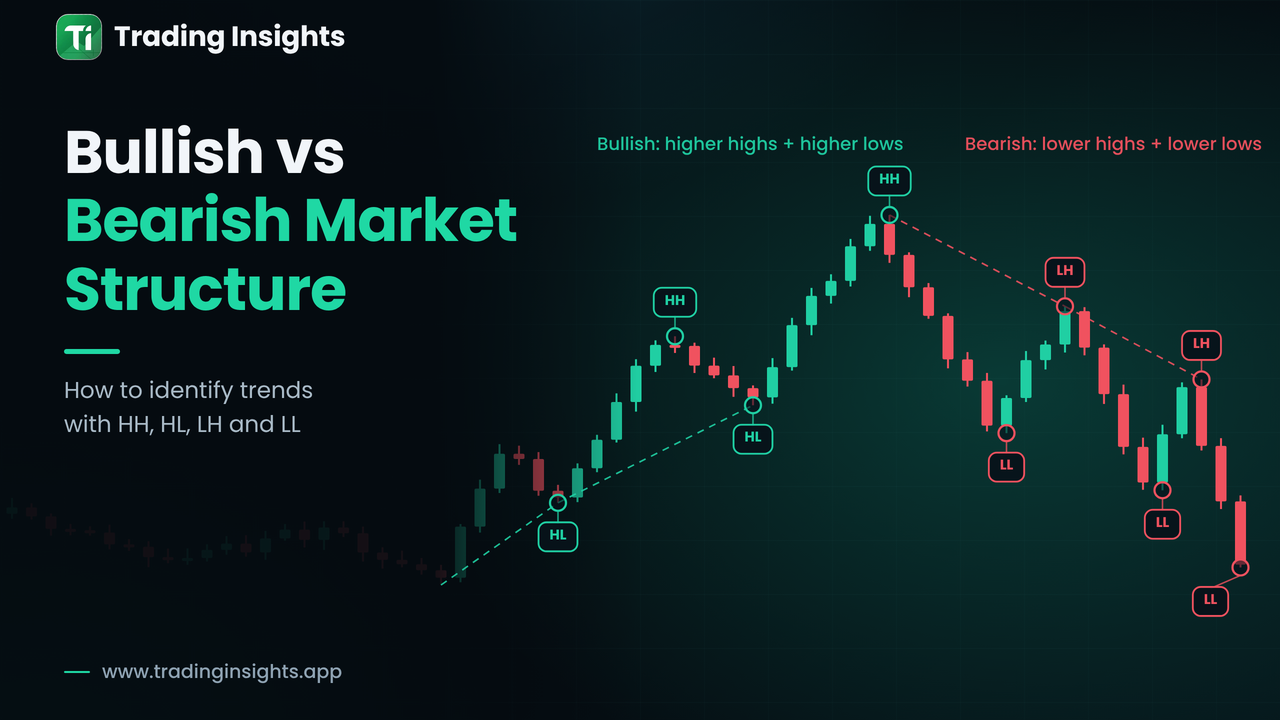 Price Action
Bullish structure builds higher highs and higher lows; bearish structure builds lower highs and lower lows. Learn to label both and spot when a trend is weakening.
Read more →Signals are free on the website. Get the Trading Insights app for instant push alerts, the MT4/MT5 auto-execution EA and a live results dashboard.
