A rejection block is the area covered by the long wick of a candle at a swing high or swing low. The wick shows that price travelled into a level and was pushed back, so traders mark the wick zone and watch how price behaves when it returns. It is a way of reading rejection as an area instead of a single line.
The idea in simple terms
When a candle has a long wick, it means price moved far in one direction and then reversed before the candle closed. At a swing low, a long lower wick shows sellers pushed price down but could not hold it there. At a swing high, a long upper wick shows buyers pushed up but could not hold the move. The wick is the visible record of that rejection, and the rejection block is the zone that records it.
Bullish rejection block
A bullish rejection block forms at a swing low whose candle has a long lower wick. The zone runs from the low of the wick to the lower edge of the candle body. Traders often add the wick's midpoint as a reference line. If price comes back into the zone and holds above that midpoint, it is seen as a sign that buyers still defend the area.
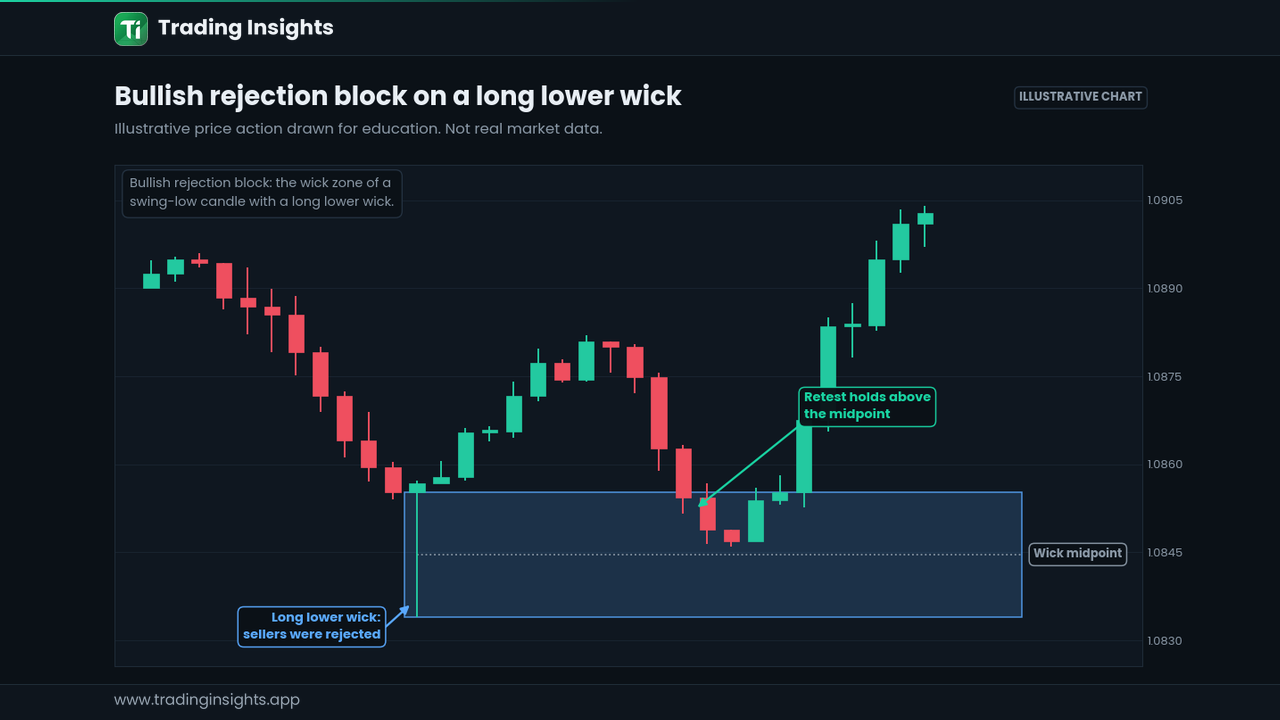
Figure 1: A bullish rejection block. The wick zone is retested and holds above its midpoint.
Bearish rejection block
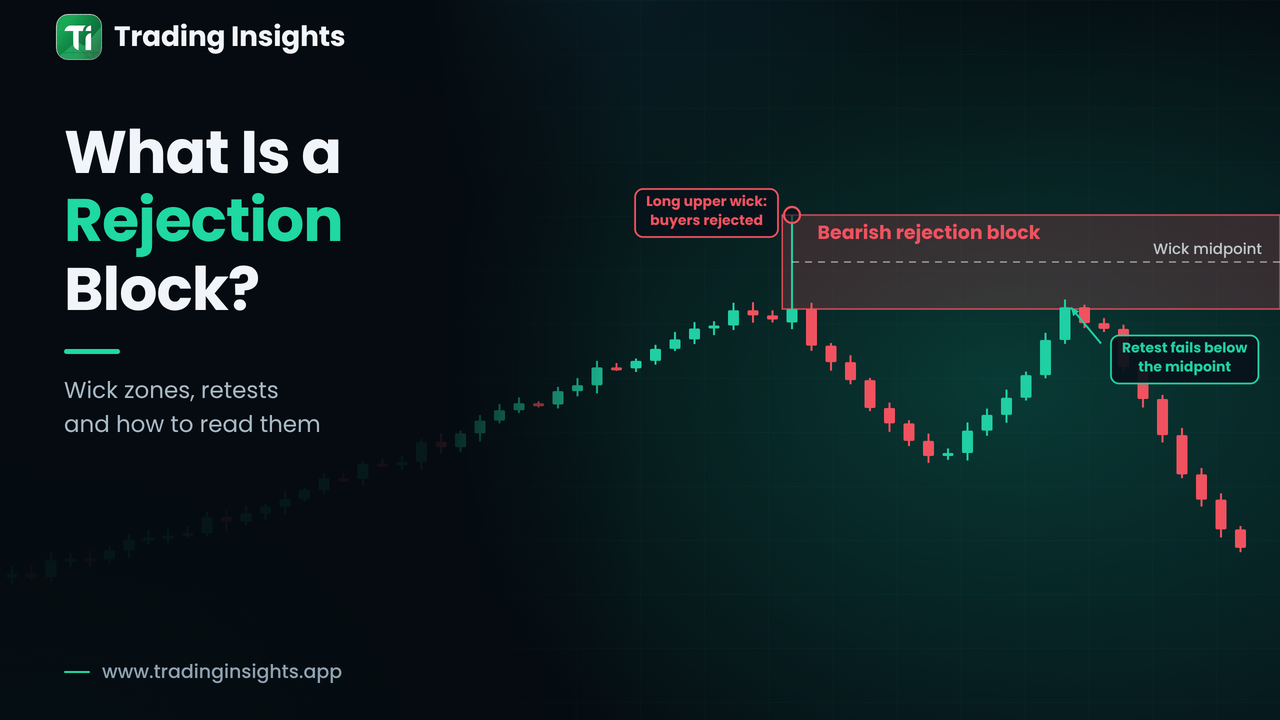
A bearish rejection block is the mirror image. It forms at a swing high with a long upper wick. The zone runs from the upper edge of the body to the top of the wick. If price rallies back into it and cannot stay above the midpoint, sellers are seen as still defending the area.
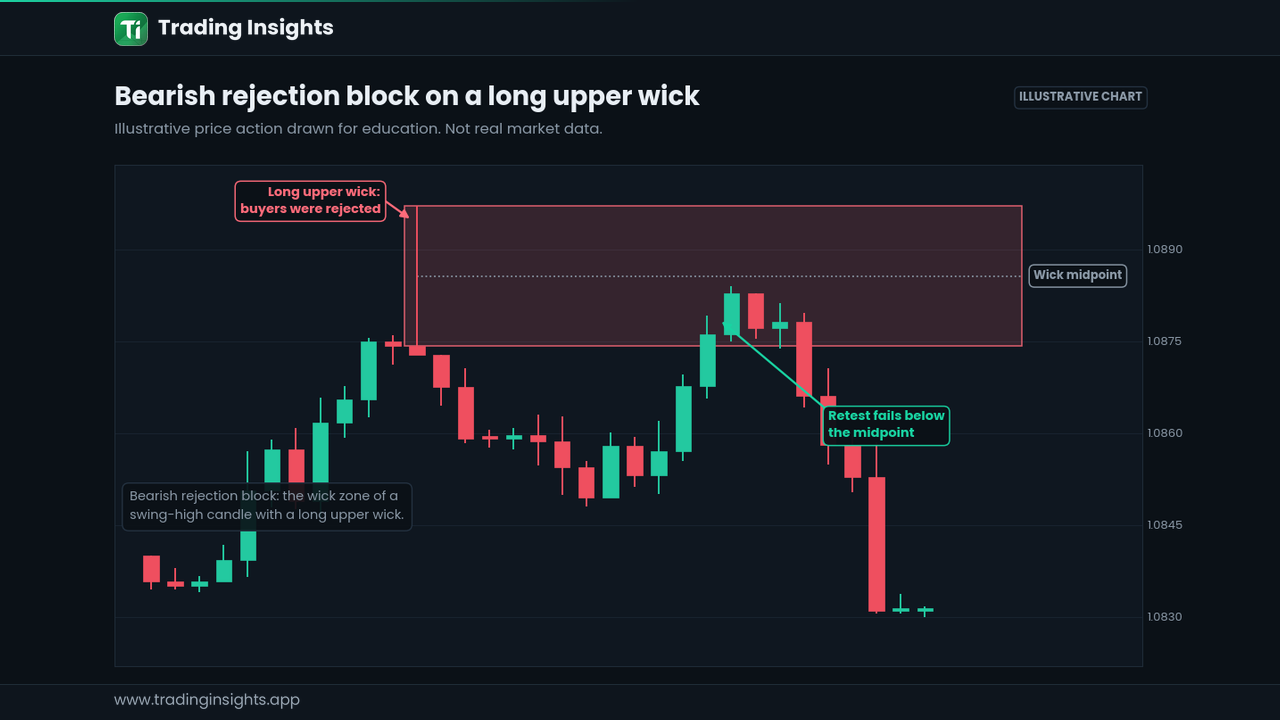
Figure 2: A bearish rejection block. The wick zone is retested and price fails to hold above its midpoint.
How to mark a rejection block
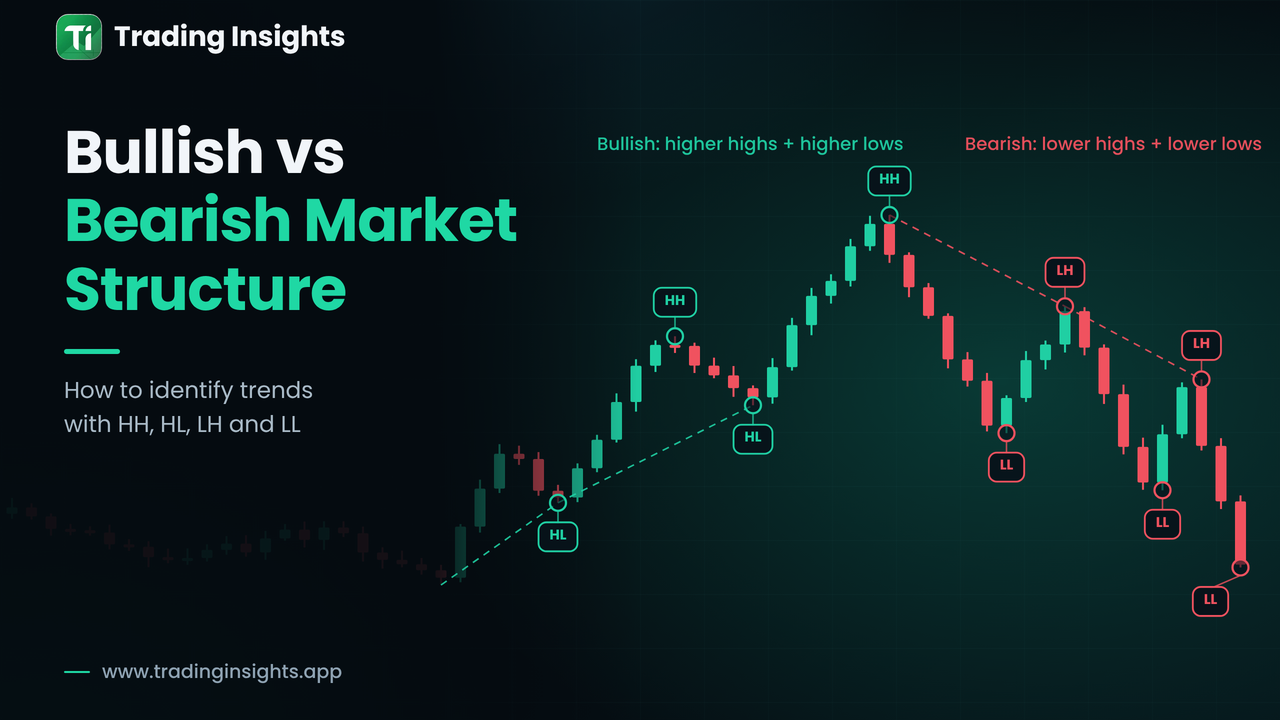
Find a clear swing high or swing low. See what market structure is if you need a refresher.
Check that the candle has a wick that is large compared with its body, typically a majority of the candle's range.
Draw the zone across the wick, from its tip to the edge of the body.
Add a line at the wick's midpoint as a reference.
Extend the zone to the right and watch for a return.
When a rejection block is more meaningful
Location. It forms at a significant swing, not in the middle of noise.
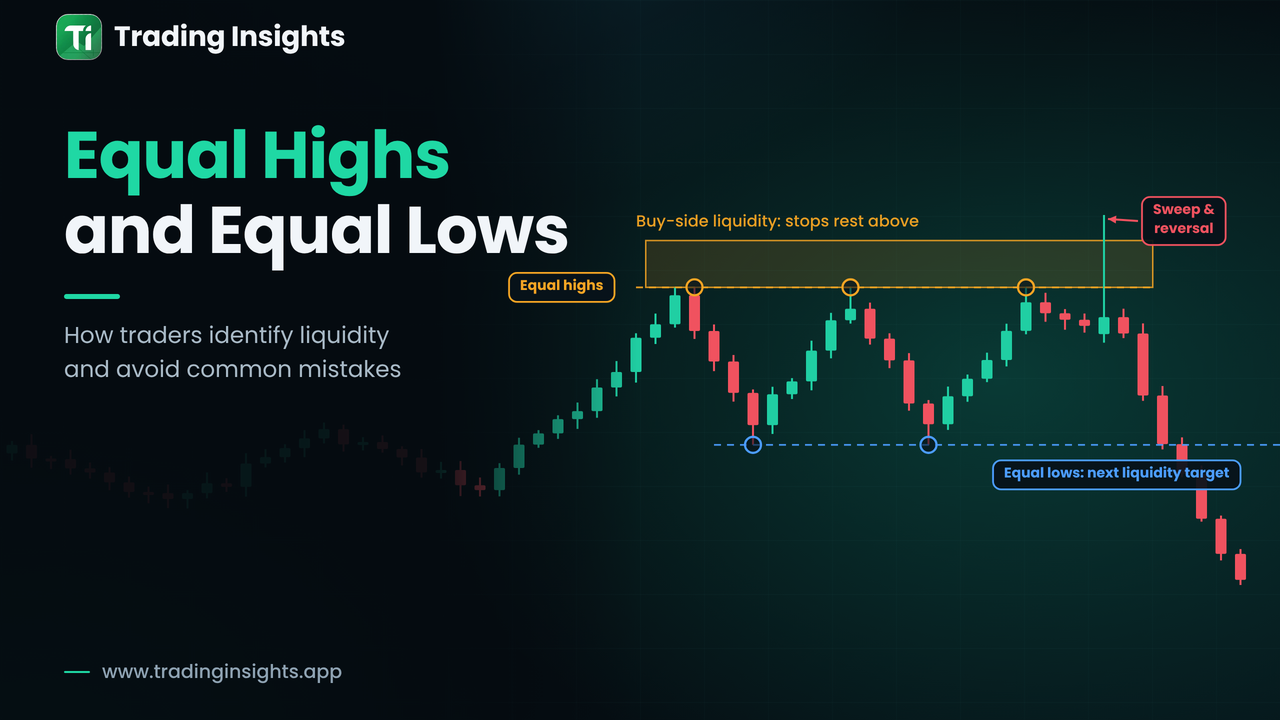
Liquidity. The wick takes out a visible level, such as equal highs or lows, which suggests orders were collected before the rejection.
Aftermath. Price moves away with energy and breaks structure after the wick.
Timeframe. A rejection candle on H4 or Daily typically weighs more than one on M1.
The first two points tie directly to the idea in what a liquidity pool is: a long wick beyond an obvious level is often a sweep that ends in rejection.
Rejection block vs order block
Rejection block | Order block | |
|---|---|---|
What is marked | The wick of a swing candle | The last opposite candle before a strong move |
Core signal | Price was pushed back | Orders may remain at the origin of a move |
Requires a structure break? | Not by itself, though it helps | Yes, usually |
Reference points | Wick tip, body edge, midpoint | Candle high and low or body |
A rejection block can sit inside an order block, and the two zones may overlap. If price later fails to respect an order block, the zone may become a breaker, which is discussed in breaker block vs order block.
How price tends to behave on the retest
Watch for three things when price returns to a rejection block. First, does it reach into the wick zone or stop short? Second, does it hold on the correct side of the midpoint? Third, does it print a small rejection of its own, such as another wick, a smaller candle or a lower-timeframe shift in structure? A zone that fails these tests is less reliable. A close through the far side of the block generally means it has failed.
Where to place risk
Because a rejection block is built from a wick, it can be large. Decide up front whether you will use the whole wick or only the half nearest the body, and where a close would show the idea has failed, for example beyond the tip of the wick. If that distance is too wide for your risk limit, the answer is to reduce size or skip the idea, not to force the stop tighter than the structure allows.
Common mistakes
Marking every candle with a wick, instead of only those at meaningful swings.
Using enormous wicks as zones, which leave no room for a sensible stop.
Entering as soon as price touches the zone with no reaction to read.
Forgetting that the same zone can fail. Define where the idea is wrong first.
Frequently asked questions
Is the whole wick the block, or just part of it?
Definitions differ. Some traders use the full wick, others the half closest to the body. Choose one and keep it consistent.
Does a rejection block need a higher timeframe?
No, but zones from higher timeframes generally carry more weight because more participants see them.
Is a rejection block the same as a pin bar?
A pin bar is the candle pattern. The rejection block is the zone you draw from it and track afterwards.
This article is for education only and is not financial advice. Trading carries risk, and no zone is guaranteed to hold.