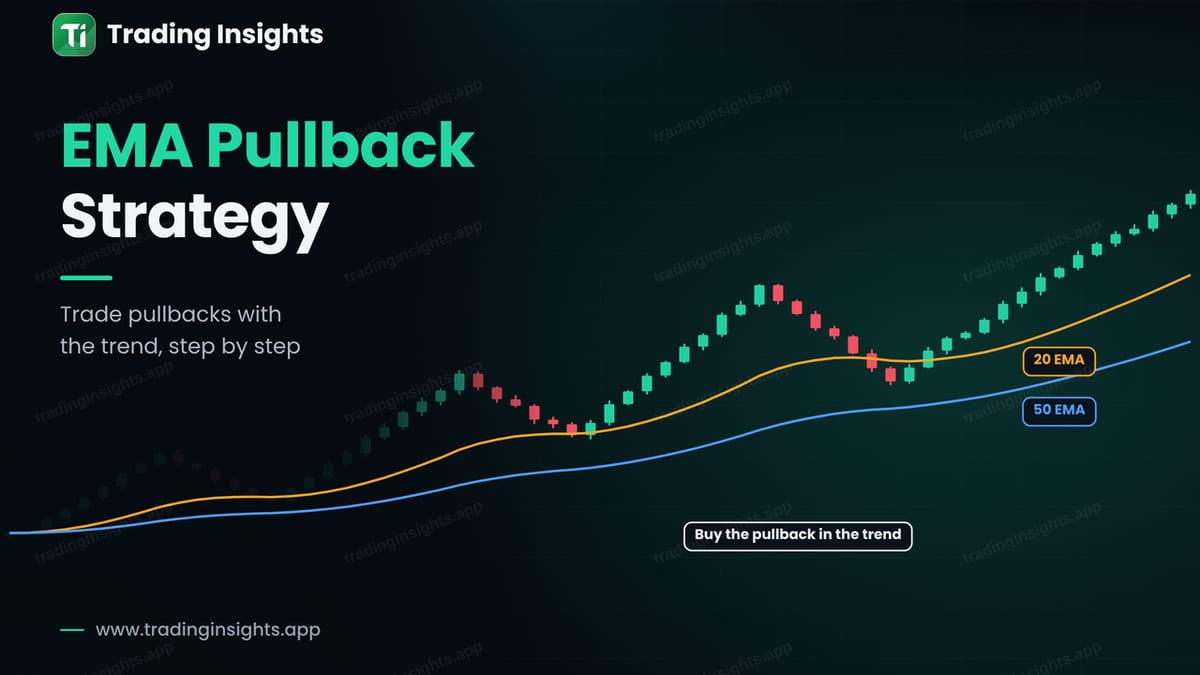
The EMA pullback strategy is one of the simplest ways to trade with the trend. You use two exponential moving averages, usually the 20 and the 50, to confirm that the market is trending. Then you wait for price to pull back toward them and enter when the pullback ends, instead of chasing the move. The idea is to buy a temporary dip in an uptrend or sell a temporary rally in a downtrend. This guide explains the setup, shows when to take it and when to skip it, and walks through a trade with a stop, a target and a lot size. It is a simple strategy and not a guaranteed one, since pullbacks sometimes turn into reversals.
What you need
You need only a clean chart with two exponential moving averages. An EMA gives more weight to recent prices than a simple average, so it reacts faster. If you are not sure about the difference, read moving averages: SMA vs EMA first.
- 20 EMA: follows short-term price closely. Pullbacks often end near it in a strong trend.
- 50 EMA: shows the medium-term trend. Deeper pullbacks tend to end near it.
The numbers 20 and 50 are common choices and not magic values. Whatever you pick, keep them fixed and test them.
The setup, step by step
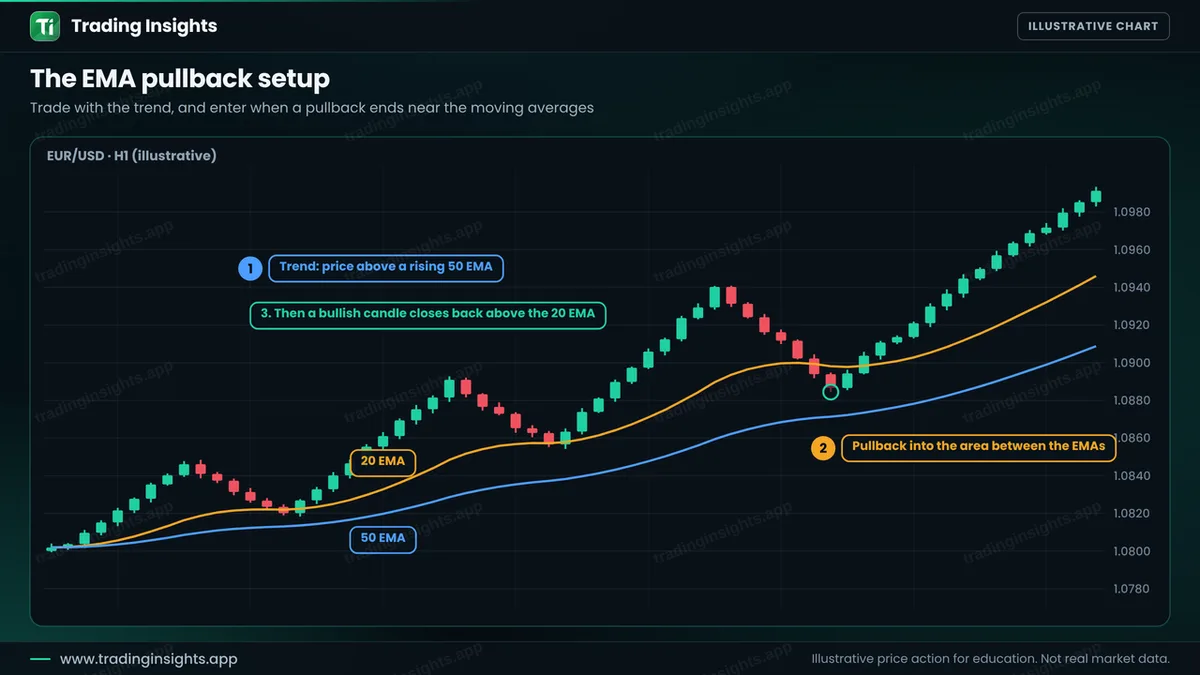
- Confirm the trend. Price is above a rising 50 EMA, and the 20 EMA is above the 50 EMA. For a downtrend, reverse everything.
- Wait for the pullback. Price falls back toward the 20 EMA or into the area between the two EMAs. Do not buy while it is still falling.
- Wait for the trigger. A bullish candle closes back above the 20 EMA, which suggests that the pullback has ended. Candle patterns can help, as in candlestick patterns for beginners.
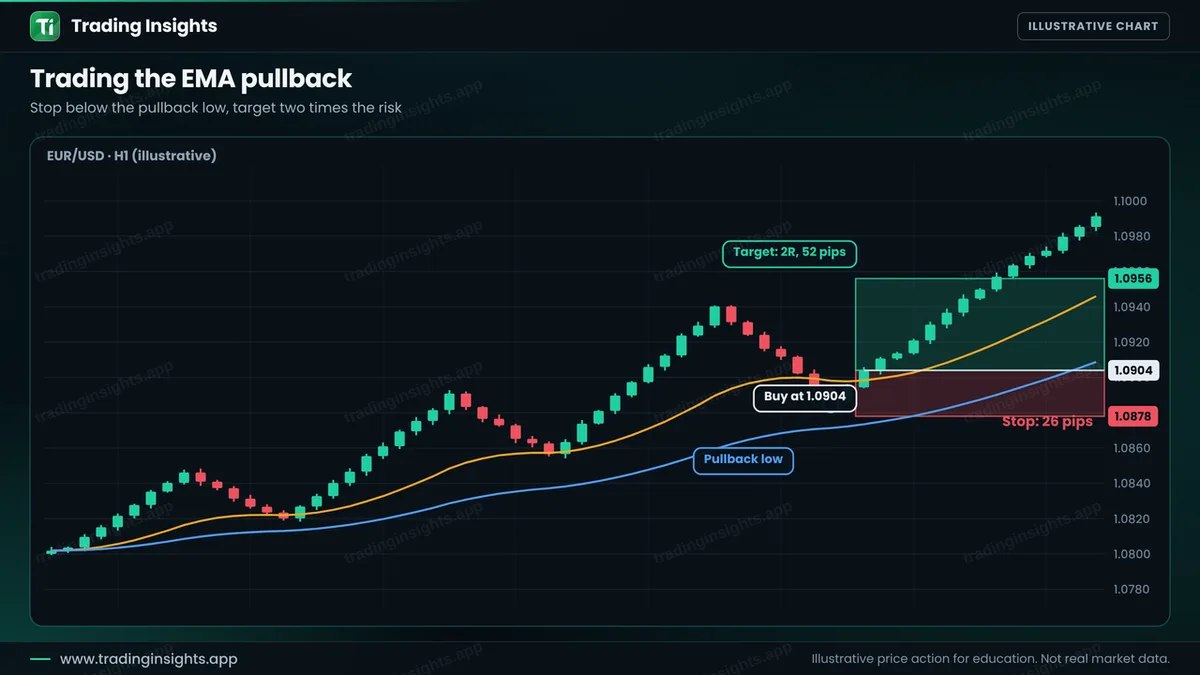
- Place the stop. Below the pullback low, with a small buffer.
- Set the target. A multiple of the risk, such as 2R, or the previous swing high.
When to take it and when to skip it
Moving averages only work well when the market is trending. In a range, price crosses the averages again and again, and every pullback signal fails.
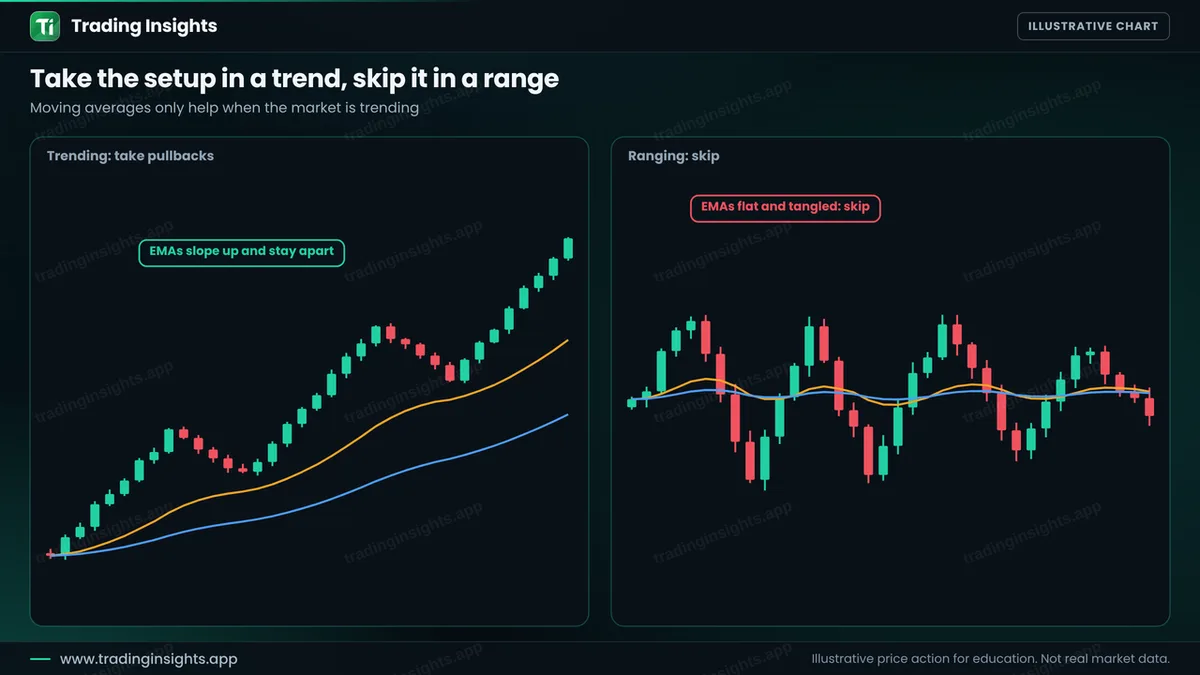
A simple filter is to look at the slope and the gap. If both EMAs slope in the same direction and there is clear space between them, the trend is healthy. If they are flat, close together and crossing, stay out. You can also check the higher timeframe, as in top-down analysis, and look at the swing structure, as in what market structure is. A pullback that breaks the last higher low is a warning, since it may be a change of character and not a pullback.
A worked trade
This is an illustrative buy on EUR/USD, H1. Price is in an uptrend above both EMAs. It pulls back into the area between the 20 and the 50 EMA and makes a low. The next bullish candle closes back above the 20 EMA at 1.0904. You buy there, place the stop below the pullback low and aim for twice the risk.