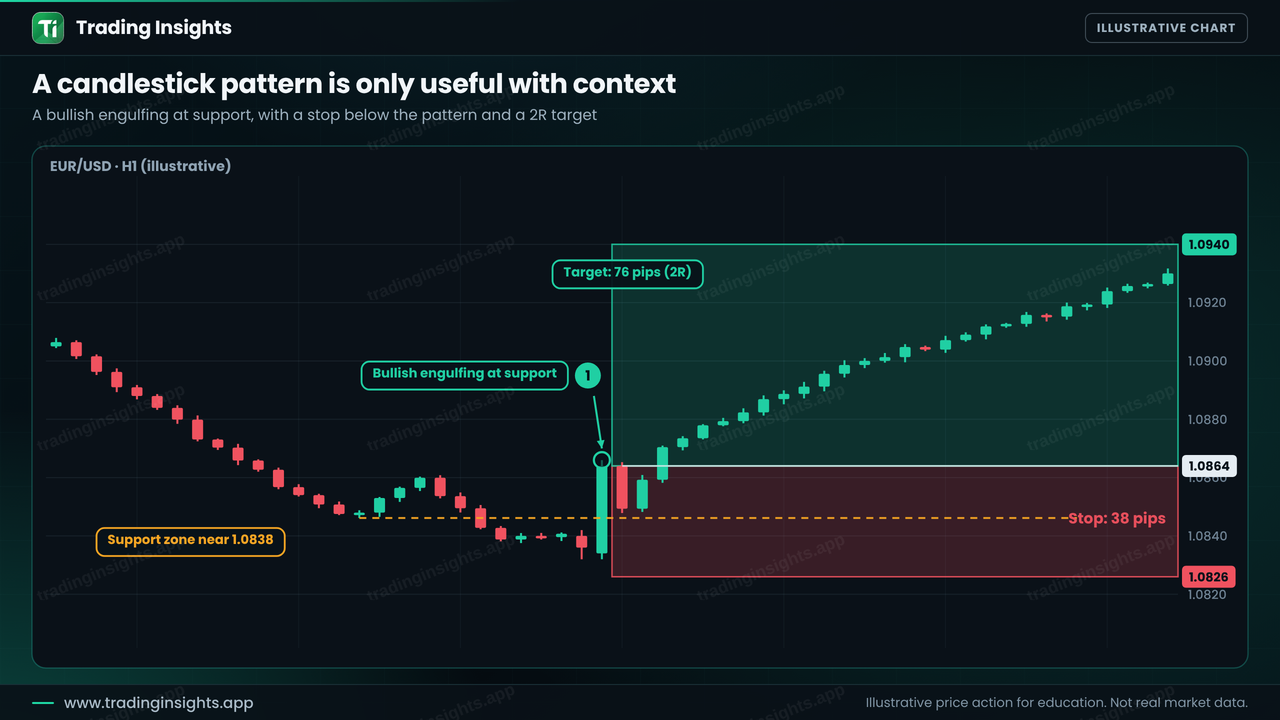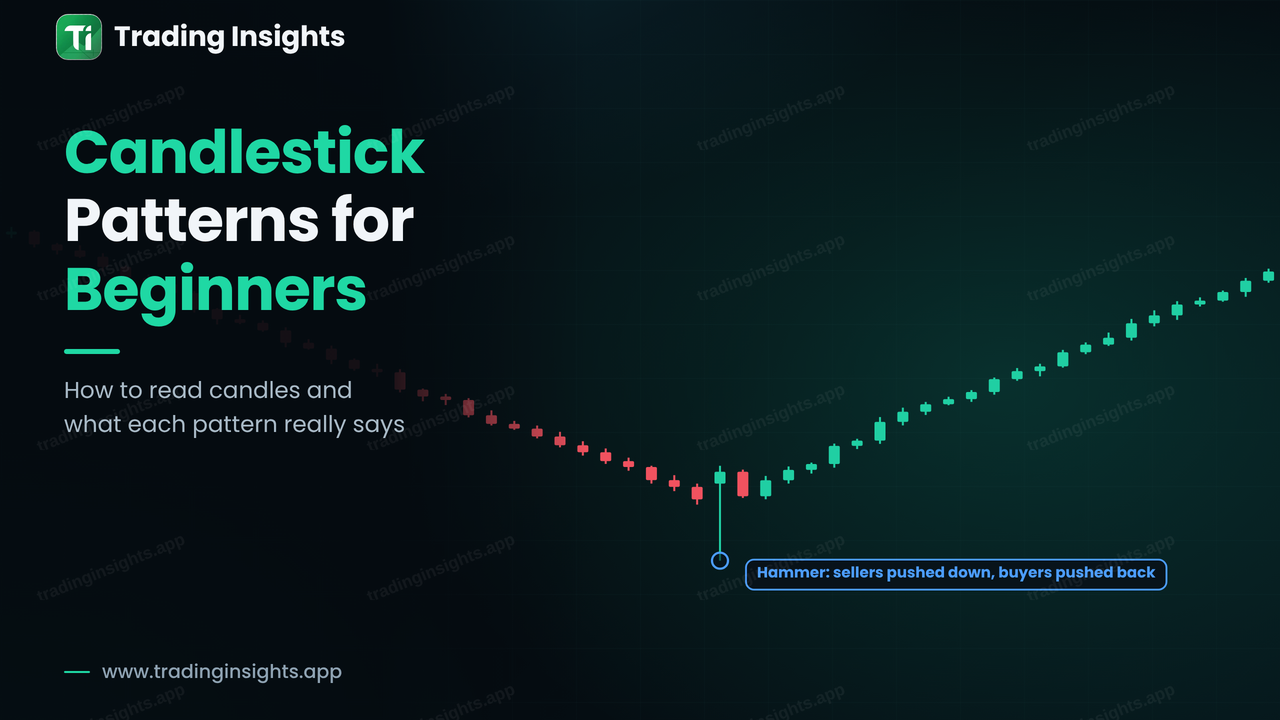
A candlestick packs four prices into one shape: the open, the high, the low and the close of a period. Reading the shape tells you who was in control during that period, and groups of candles form patterns that traders use to judge whether a move may continue or pause. This guide explains the anatomy of a candle, six patterns every beginner should know, and the most important lesson about them: a pattern is only useful when it forms in the right place. You will also see a worked trade with an entry, a stop and a target.
The anatomy of a candlestick
Every candle has a body and up to two wicks (also called shadows). The body runs from the open to the close. The wicks show how far price travelled beyond the body before it was pushed back.
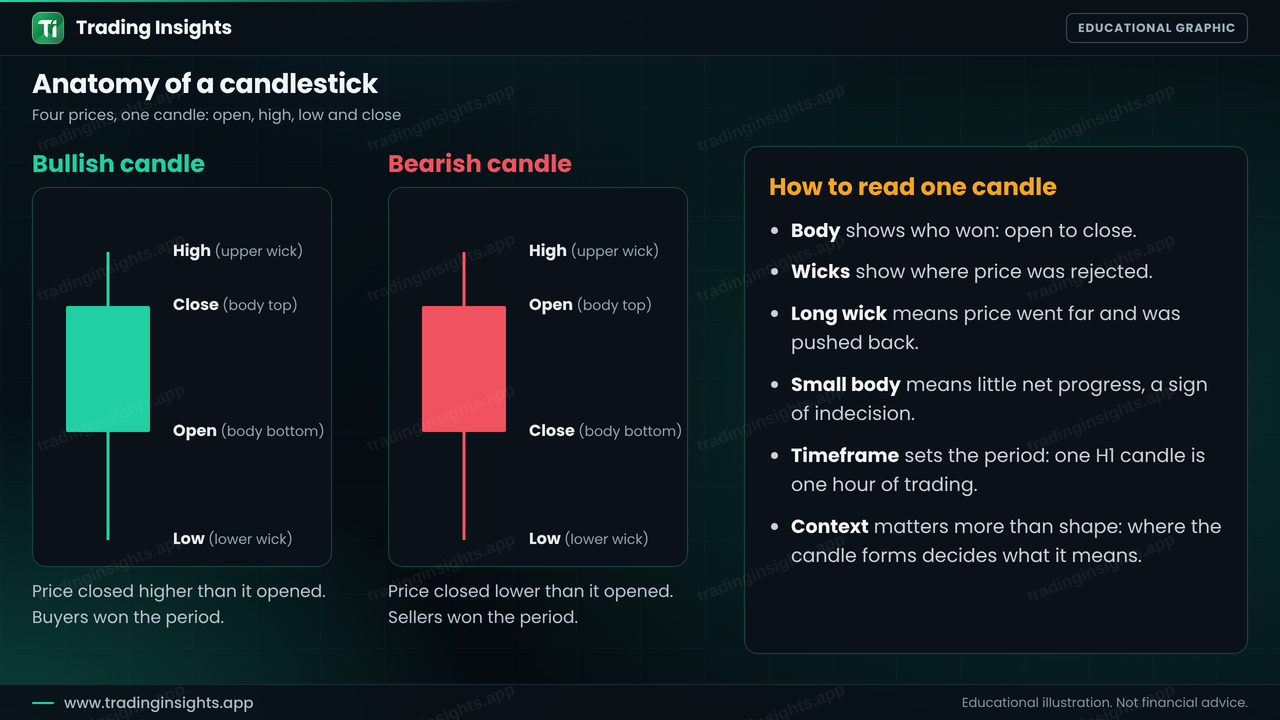
- Bullish candle: the close is higher than the open. Buyers won the period.
- Bearish candle: the close is lower than the open. Sellers won the period.
- Long body: strong, one-sided movement.
- Long wick: price went far in one direction, then was pushed back. That rejection is the clue many patterns are based on.
- Small body: little net progress, a sign of indecision.
The period of a candle depends on your timeframe. A single H1 candle represents one hour of trading. Higher timeframes such as H4 and Daily carry more weight, as explained in top-down analysis in forex.
Six candlestick patterns every beginner should know
Below are six common patterns. Each one describes a short story, and none is a trading signal on its own.
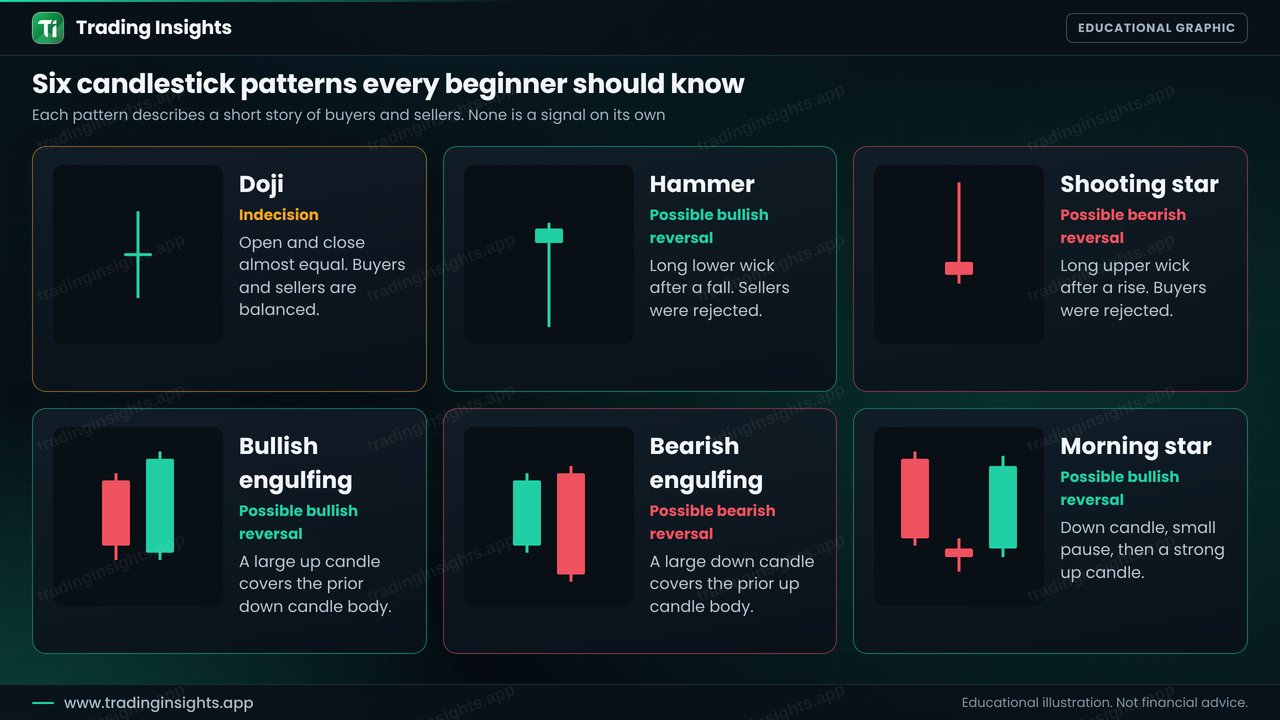
- Doji: the open and close are almost equal, so the body is tiny. It shows indecision. It matters most after a long move, when it may show that the move is running out of energy.
- Hammer: a small body near the top with a long lower wick, after a decline. Sellers pushed price down, then buyers pushed it back up. It can warn of a bullish reversal.
- Shooting star: a small body near the bottom with a long upper wick, after a rise. Buyers pushed price up and were rejected. It can warn of a bearish reversal.
- Bullish engulfing: a large bullish candle whose body covers the body of the previous bearish candle. It suggests buyers have taken over.
- Bearish engulfing: a large bearish candle whose body covers the previous bullish body. It suggests sellers have taken over.
- Morning star: three candles: a bearish candle, a small pause candle, then a strong bullish candle. It describes a shift from selling to buying.
These patterns are descriptions of behaviour. They do not predict what price will do next, and they appear all the time on every chart. A hammer in the middle of a quiet range means almost nothing.
Context is what makes a pattern useful
Traders who rely on shape alone tend to lose money, because most patterns fail when they form in the wrong place. Three questions improve the odds:
- Where did it form? A pattern at a clear support or resistance level, or a supply or demand zone, carries more information than one in empty space. See support and resistance vs supply and demand zones.
- What came before it? A reversal pattern needs a move to reverse. A hammer needs a decline, and a shooting star needs a rise.
- Does structure agree? A bullish pattern in an uptrend, or at the end of a pullback, is usually preferred over one against the trend. Check market structure before you act.