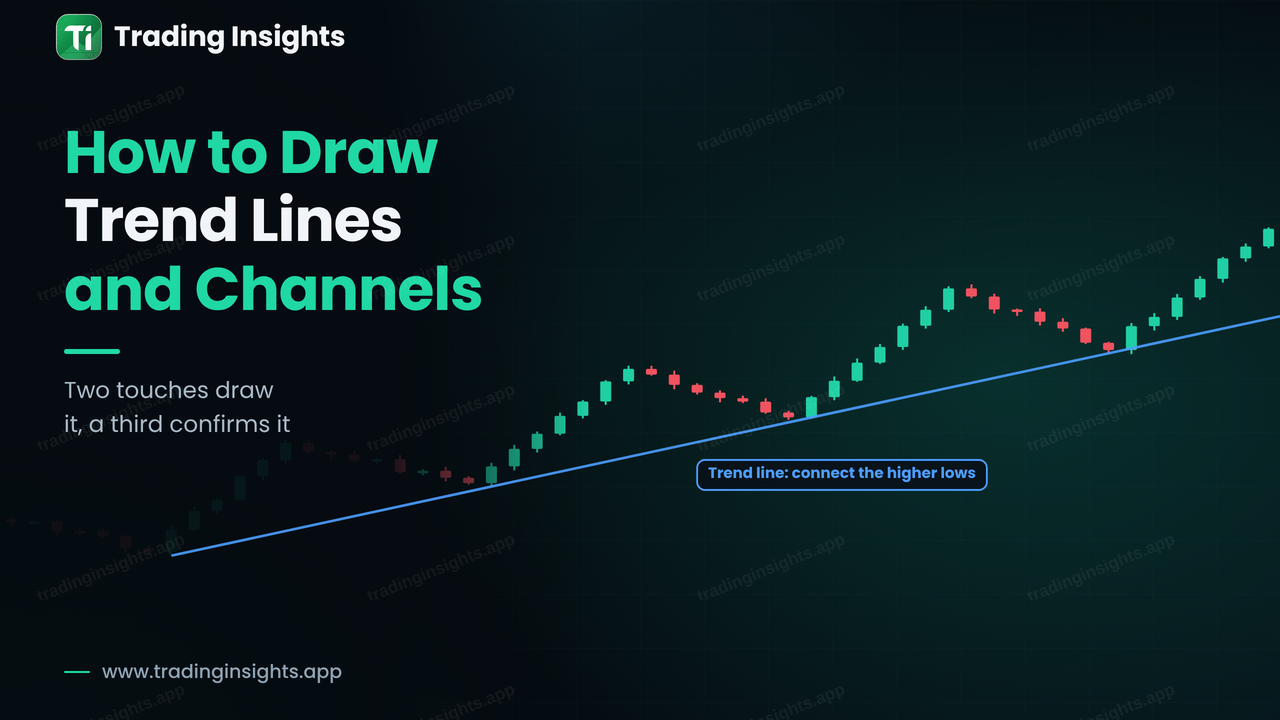
A trend line is a straight line that connects a series of swing lows in an uptrend, or swing highs in a downtrend. It is one of the oldest tools in technical analysis and one of the most useful, because it shows the direction of the trend, gives you a moving level of support or resistance, and warns you when the trend may be ending. A channel adds a second, parallel line and shows the full range price is moving in. This guide shows how to draw both correctly, what makes a line valid, how to read the break of a trend line, and how to plan a trade around it with a stop and a target.
How to draw a trend line
The rules are simple, and most of the mistakes come from ignoring them.
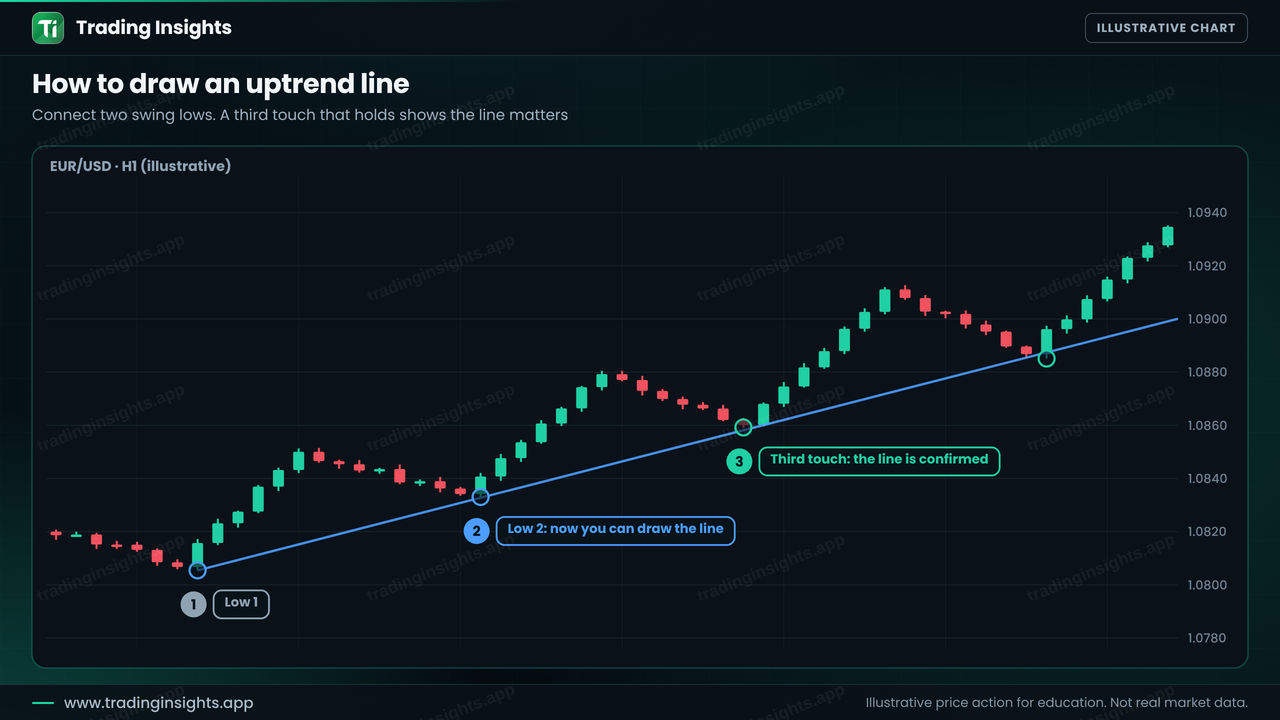
- Find the trend. You need at least two swing points to draw a line, and the trend should be clear. If you are not sure what a swing is, read what market structure is.
- In an uptrend, connect the swing lows from below. In a downtrend, connect the swing highs from above.
- Use the wicks or the bodies, but be consistent. Most traders use wicks for swing points. Perfect precision is not possible, so allow for small overshoots.
- Wait for a third touch. Two points make a line, but three touches make it a trend line worth trusting. Each time price reacts to the line, it becomes more significant.
Two further rules help. A very steep line is usually unsustainable and breaks quickly, so a moderate slope is more reliable. And a line that is drawn over a long period and a high timeframe carries more weight than one drawn on a few candles on a one-minute chart, in the same way as any other level on a larger timeframe, as explained in top-down analysis.
How to add a channel
A trend channel is created by drawing a second line parallel to the trend line. In an uptrend, you copy the trend line and move it to the highest swing high between the touches. The area between the two lines is the channel. Price tends to move back and forth inside it, with the lower line acting as support and the upper line as resistance.
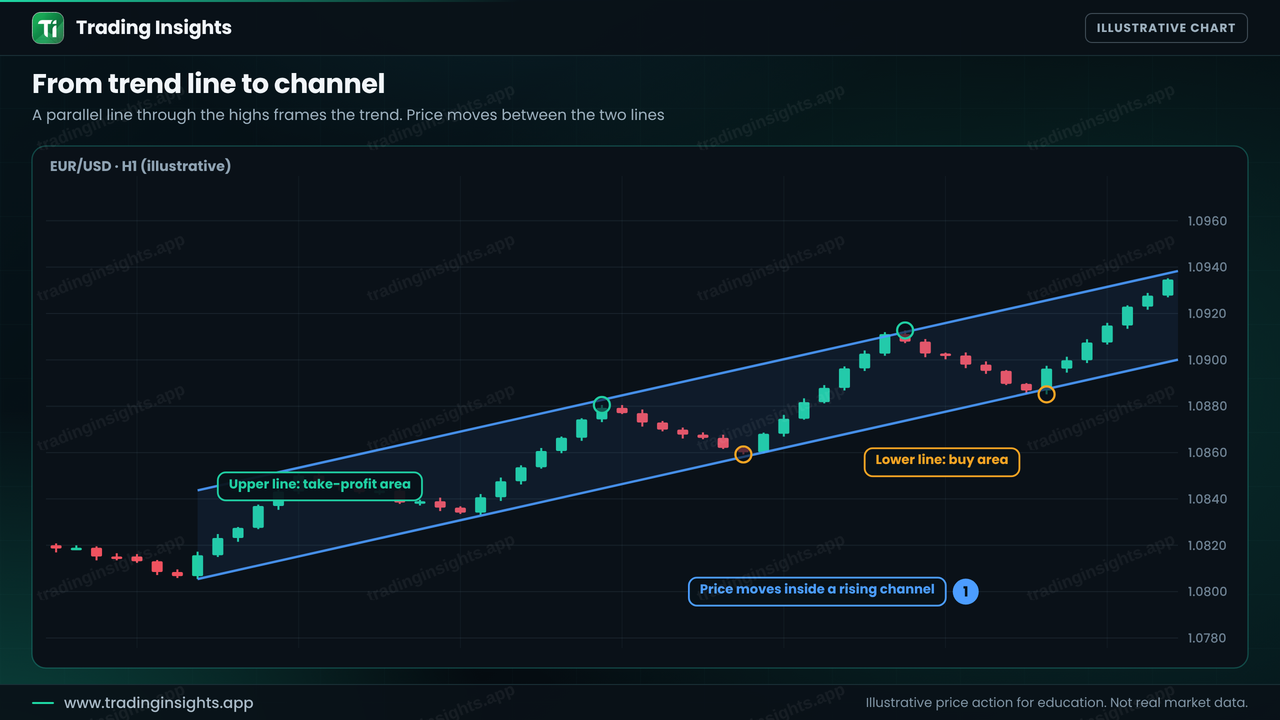
Traders use channels in three ways. In an uptrend, the lower line is an area to look for buys on a pullback. The upper line is an area to take profit or to be careful. And a break out of the channel, especially through the lower line, warns that the trend is changing. Try not to sell only because price has reached the top of the channel in an uptrend, since strong trends can break out upward and keep going. This is the same lesson as with Bollinger Bands: touching an edge does not mean a reversal.
What a trend line break means
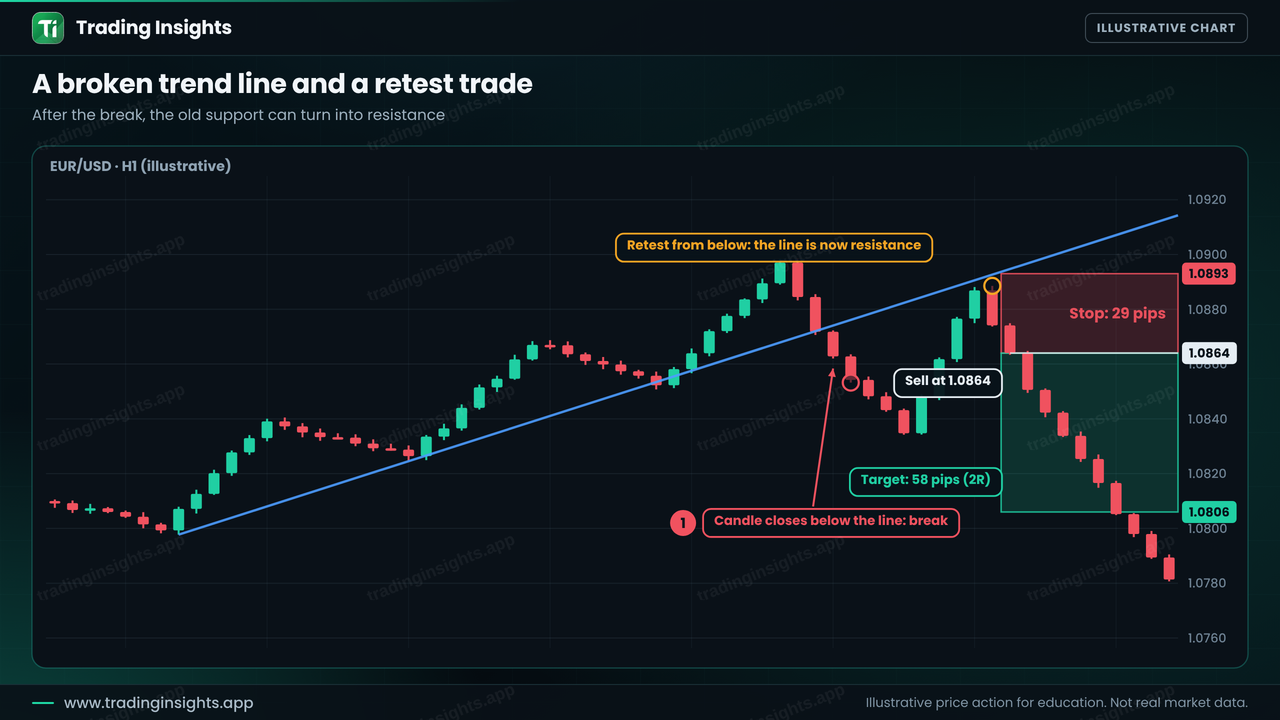
When a candle closes beyond the trend line, the line is broken. It is an early sign that the trend is slowing, but not yet proof that it has reversed. A break can be a false break, and price can return to the trend. Ways to filter false breaks include:
- Wait for a candle close beyond the line, not only a wick.
- Look for a break of the last swing point as well. See break of structure and change of character.
- Check the higher timeframe. A break against the larger trend is less reliable.