
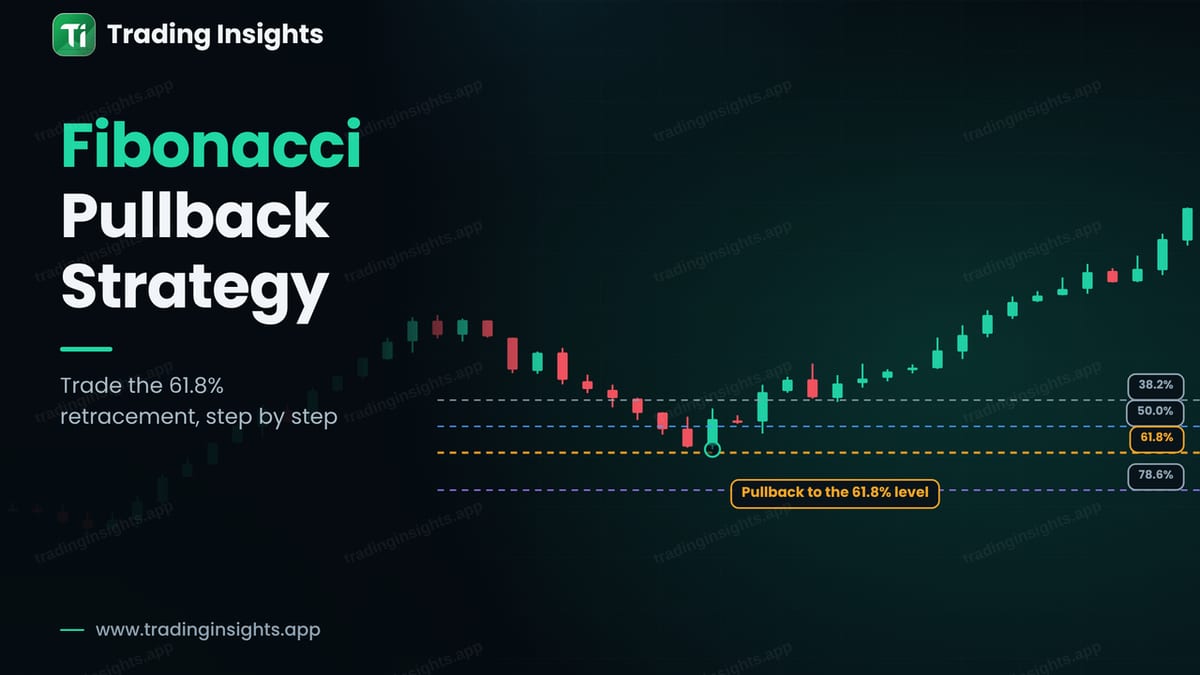
Fibonacci retracement levels are among the most widely used tools in trading. The idea is that after a strong move, price often pulls back by a certain fraction of that move before it continues. The levels most traders watch are 38.2%, 50%, 61.8% and 78.6%. The Fibonacci pullback strategy uses them to find an entry in the direction of the trend, after the pullback, instead of chasing the move. This guide shows how to draw the levels, what each one tells you, and how to plan a trade with a stop loss and an extension target. It does not claim that the levels are magic: they are areas where many traders look, which is why price sometimes reacts there. If you want the tool explained from the beginning, read Fibonacci retracement explained.
How to draw the levels
First find a clear impulse, a strong move from a swing low to a swing high in an uptrend. Then draw the retracement tool from the swing low to the swing high, so that 0% is at the high and 100% is at the low. The tool shows the levels in between.
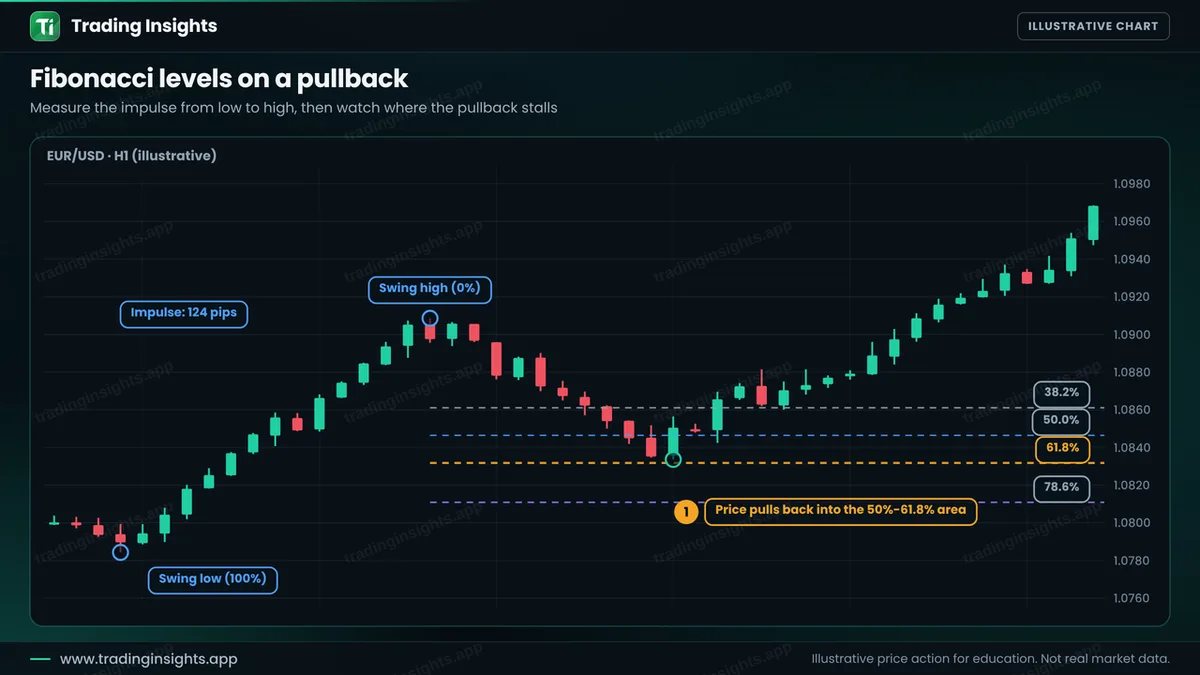
Use swings that are clear, as in swing highs and lows. If you have to search for the swing points, the move is probably not clear enough. For a downtrend, draw from the swing high to the swing low and look for rallies into the levels.
What each level tells you
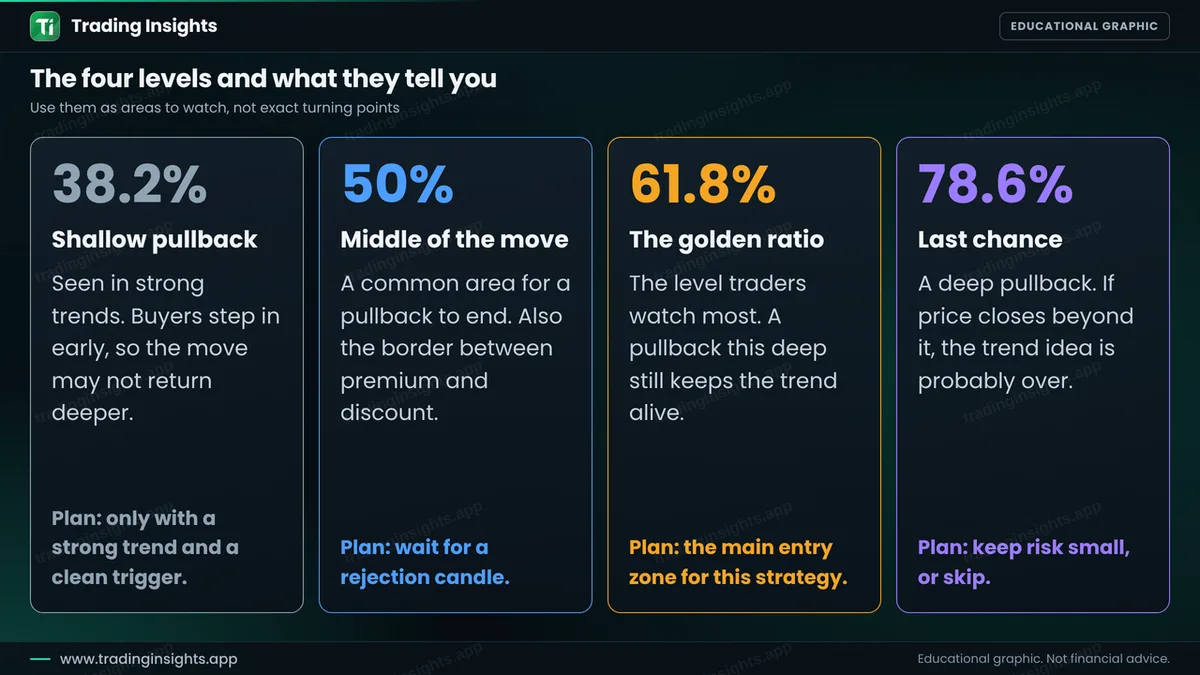
- 38.2%: a shallow pullback, seen in strong trends. Buyers step in early.
- 50%: the middle of the move and a common area for a pullback to end. It is also the border between the premium and discount halves, see premium and discount zones.
- 61.8%: the golden ratio, the level most traders watch. A pullback this deep still keeps the trend alive.
- 78.6%: a deep pullback. If price closes beyond it, the trend idea is probably over.
The rules, step by step
- Identify the trend. The strategy works with the trend. See top-down analysis.
- Measure the impulse. Draw from the swing low to the swing high.
- Wait for the pullback. Price comes back toward the 50% to 61.8% area. Do not buy while it is still falling quickly.
- Wait for a trigger. A bullish candle that closes above the high of the previous candle, a rejection candle or a change of character on a lower timeframe.
- Place the stop. Below the pullback low, with a small buffer. A closer stop than the 78.6% level gives a better ratio, but a close beyond 78.6% means the idea is over.
- Set the target. The previous swing high as a first target, and an extension such as 127.2% of the impulse as a second.
A worked trade
This is an illustrative buy on EUR/USD, H1. The impulse is 124 pips. Price pulls back to the 61.8% area, and a bullish candle closes above the previous high at 1.0866. You buy there, place the stop below the pullback low at 1.0831, and target the 127.2% extension at 1.0942.
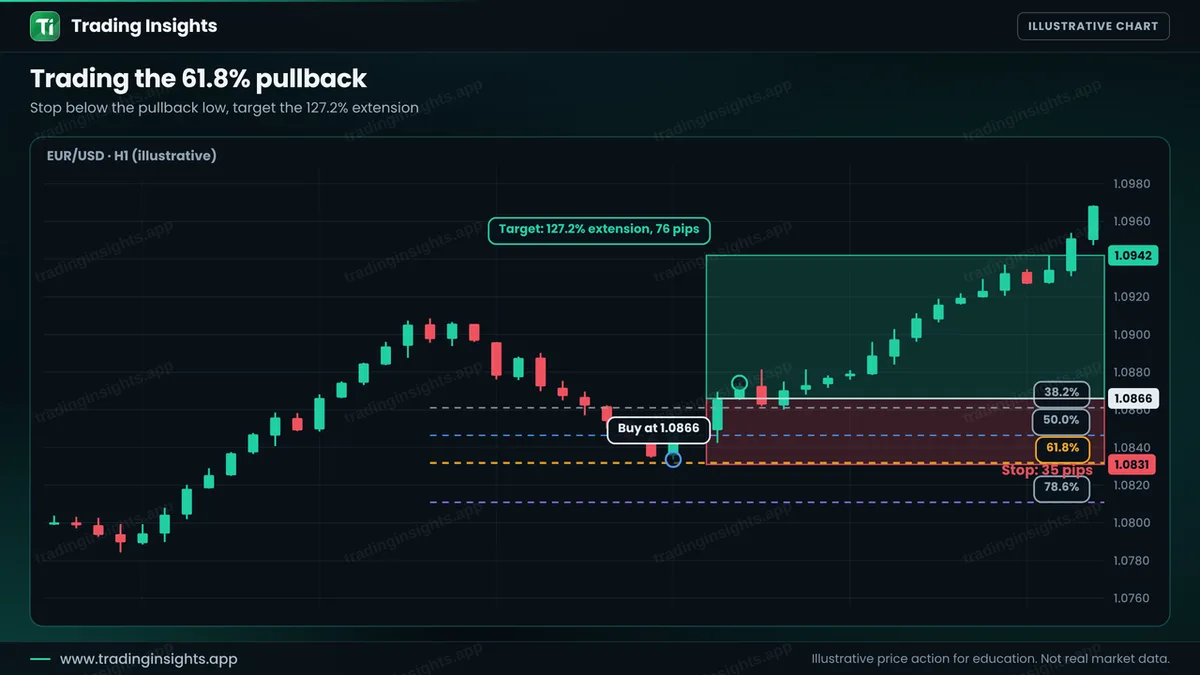
- Entry: 1.0866, after the trigger candle.
- Stop loss: 1.0831, below the pullback low (35 pips).
- Take profit: 1.0942 (76 pips), a ratio of about 1:2.2.
With a $10,000 account risking 1% ($100), the size is $100 / (35 pips x $10 per pip per lot) = about 0.29 lot. A win pays about $217, and a loss costs about $100. Some traders take half of the profit at the previous swing high and move the stop to break-even. See trailing stop and break-even stop. Check the numbers with the risk-reward calculator.
Improving the strategy
- Look for confluence. A level where the Fibonacci area meets support, a zone or a moving average has more reasons to hold. See EMA pullback strategy.
- Use clear impulses. Messy moves give messy levels.
- Be honest about the evidence. Test the strategy on past charts first. See how to backtest a forex trading strategy.
Common mistakes
- Drawing the tool from random points.
- Buying at a level without a trigger.
- Treating the levels as exact turning points.
- Using the strategy against the main trend.
- Moving the stop away when price closes beyond 78.6%.
Frequently asked questions
What is the 61.8% retracement?
It is the level where price has retraced 61.8% of the previous move. It comes from the Fibonacci ratios, and many traders watch it as a place where a pullback may end.
Which Fibonacci level is the most reliable?
None is reliable by itself. The 50% and 61.8% levels are the most commonly watched. Reliability improves when they match another level.
What is the 127.2% extension?
It is a target beyond the previous swing high, equal to 27.2% of the impulse added above it. Traders use it as a possible area where the move may slow.
Can I use it on any timeframe?
Yes, but impulses on higher timeframes give more meaningful levels than very short moves.
Trading involves risk. This is education, not financial advice. The charts are illustrative and not real market data. Trading carries risk, and no method guarantees results.


