
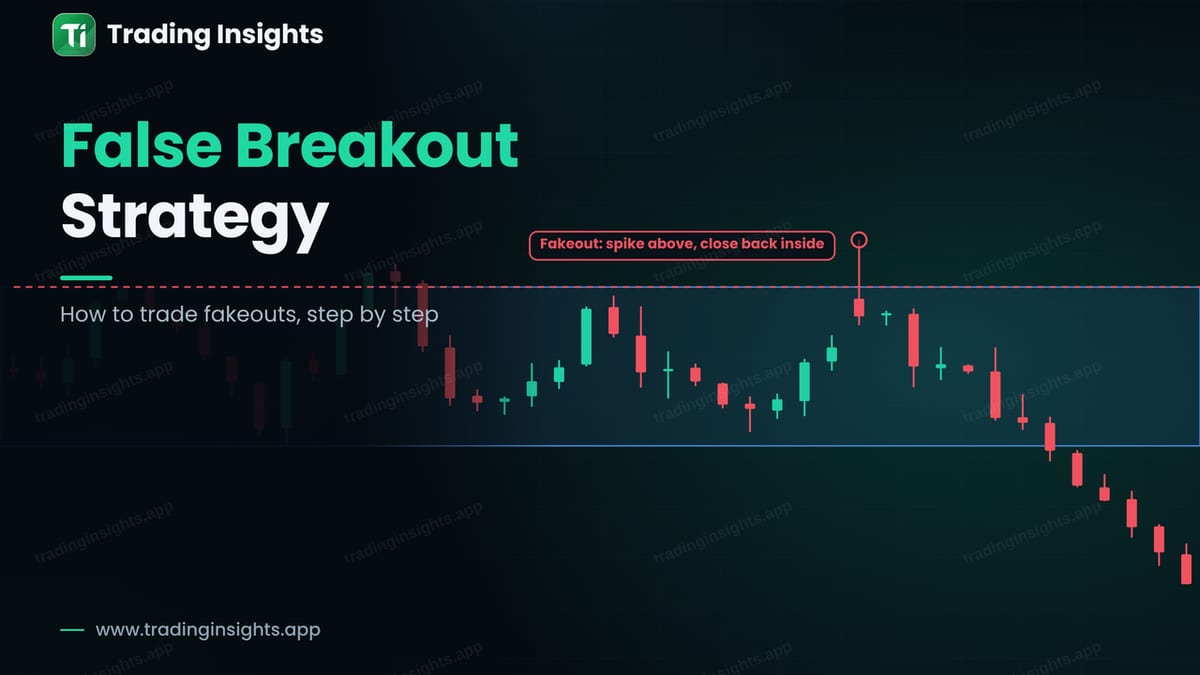
A false breakout, also called a fakeout, happens when price breaks above resistance or below support, fails to hold, and returns inside the range. Many traders entered the breakout and are now on the wrong side. When they exit, the move back inside often picks up speed. A false breakout strategy aims to trade that return.
What a false breakout looks like
The setup has three parts. First, a level that price has tested several times, such as the top of a range. Second, a spike through the level that grabs the stop orders and breakout entries above it. Third, a candle that closes back inside the range, which shows that the break failed.
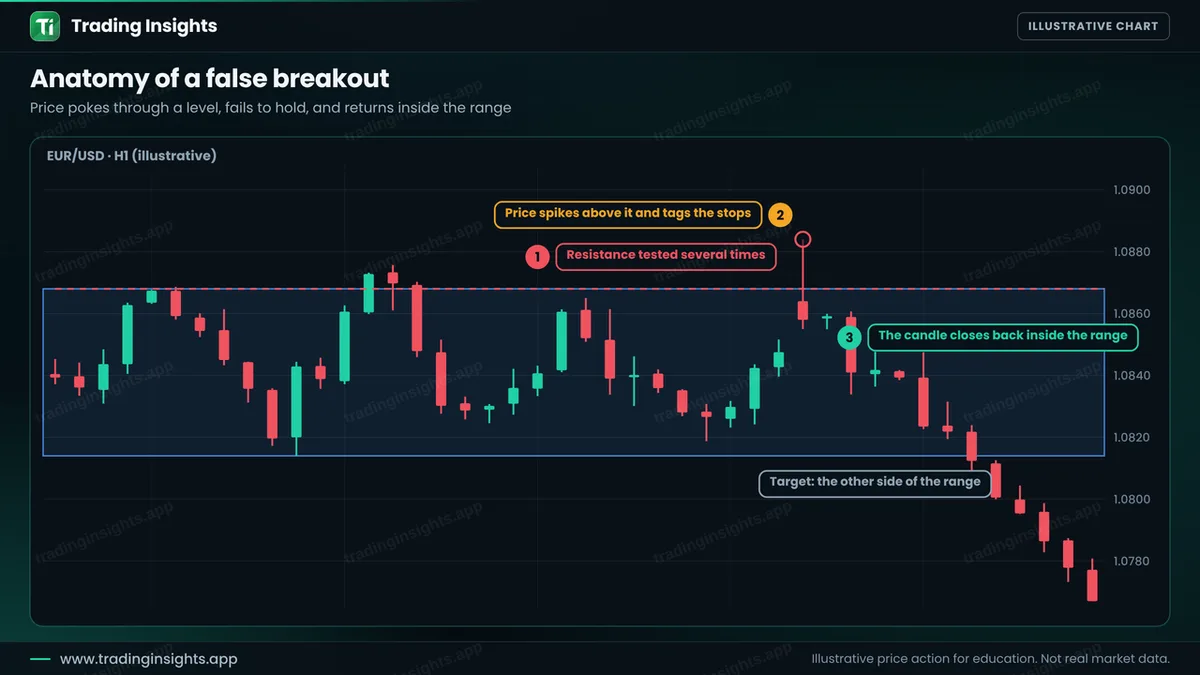
Why does this happen? Above a well-tested high there are many stop orders and many breakout entries. Large players can use that liquidity to fill their orders, and once it is taken, there is no buying left. See liquidity sweeps for more on this.
Fakeout or real breakout?
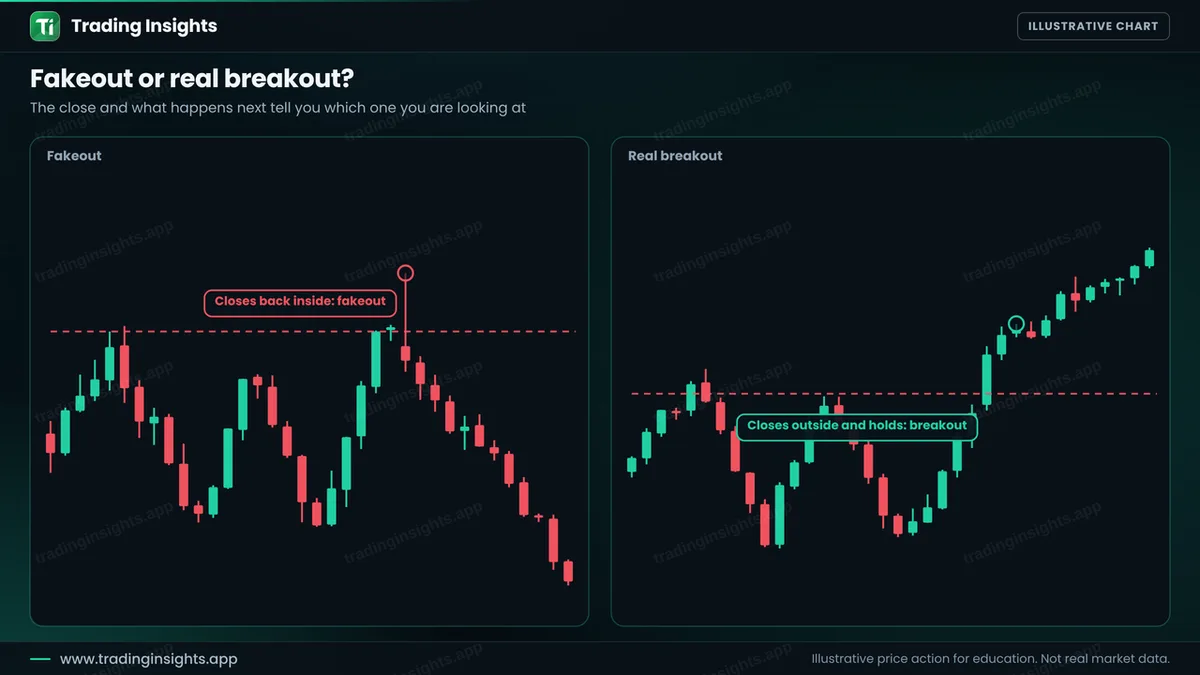
The difference is the close. In a fakeout, the candle closes back inside the range, often leaving a long wick beyond the level. In a real breakout, price closes outside and holds there, often with a retest from the other side. If you trade breakouts, see break and retest. You cannot know in advance which one will happen, so you let the close decide.
The rules, step by step
- Find a clear range. A level with several touches, such as a horizontal resistance or support.
- Wait for the spike. Price must move beyond the level. Do not trade before this happens.
- Wait for the close back inside. The candle must close inside the range. This is your confirmation.
- Enter after the close. For a spike above resistance, sell at the close or just after it.
- Place the stop. Above the high of the spike with a small buffer. If price makes a new high beyond the spike, the idea is wrong.
- Set the target. The other side of the range, or the middle if you want a safer target.
A worked trade
This is an illustrative sell on EUR/USD, H1. Price tests the top of a range near 1.0865 several times. Then it spikes above it, and a candle closes back inside the range at 1.0858. You sell there, place the stop above the spike high at 1.0887, and target the range low at 1.0817.
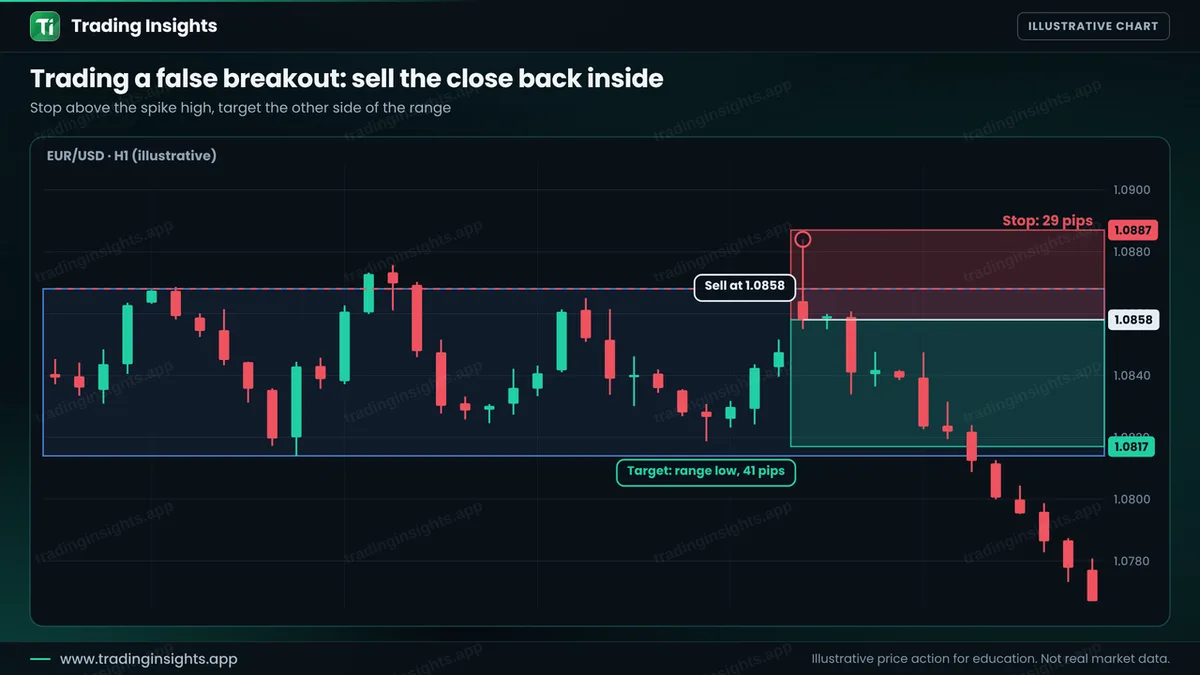
- Entry: 1.0858, after the close back inside the range.
- Stop loss: 1.0887, above the spike high (29 pips).
- Take profit: 1.0817 (41 pips), a ratio of about 1:1.4.
With a $10,000 account risking 1% ($100), the position size is $100 / (29 pips x $10 per pip per lot) = about 0.34 lot. A win pays about $140, and a loss costs about $100. Check your own numbers with the position size calculator. A ratio of 1:1.4 is acceptable but not large. A long spike makes the stop wide, so some traders wait for a small pullback before entering to improve the ratio.
How to avoid the common failures
- Do not fade a breakout without a close. Selling because price is above resistance is a guess. Wait for the close back inside.
- Respect the trend. A fakeout against a strong trend is riskier. See top-down analysis.
- Use a level with history. More touches mean more orders sitting beyond the level.
- Test it. Mark at least 50 false breakouts on past charts and record the results. See how to backtest a forex trading strategy.
Common mistakes
- Selling the first touch of resistance with no spike and no close.
- Entering before the candle closes back inside.
- Placing the stop inside the spike, where it is easily hit.
- Staying in the trade after price closes outside the range again.
- Trading it in the middle of the range, where there is no level.
Frequently asked questions
What is a false breakout in forex?
It is a move beyond a support or resistance level that fails to hold. Price closes back inside the range, and the breakout traders are trapped.
How do I know if a breakout is false?
You cannot know in advance. The close back inside the range after the spike is the confirmation, and a long wick beyond the level is a common sign.
Is a false breakout the same as a liquidity sweep?
They are closely related. A sweep takes the stop orders beyond a level, and a false breakout is the result when price then returns.
What timeframe works best?
Any timeframe can work. Higher timeframes such as H1 and H4 give fewer but cleaner signals than very low ones.
Trading involves risk. This is education, not financial advice. The charts are illustrative and not real market data. Trading carries risk, and no method guarantees results.


