
The engulfing candle is one of the best-known candlestick patterns. It is made of two candles, and the second one has a body that completely covers the body of the first. It shows a sudden change of control between buyers and sellers. In theory it is a reversal signal, but in practice its value depends on where it appears: an engulfing candle at a key level is much more interesting than one in the middle of a trend. This guide explains what to look for, why location matters, and how to plan a trade with a stop and a target. It is a simple pattern, and it needs context and risk control like any other.
What a bullish engulfing candle looks like
After a fall, a small bearish candle is followed by a large bullish candle. The body of the bullish candle opens at or below the close of the first and closes above its open, so it covers the whole body of the first candle. The wicks do not have to be covered by most definitions, but a larger candle is a clearer signal.
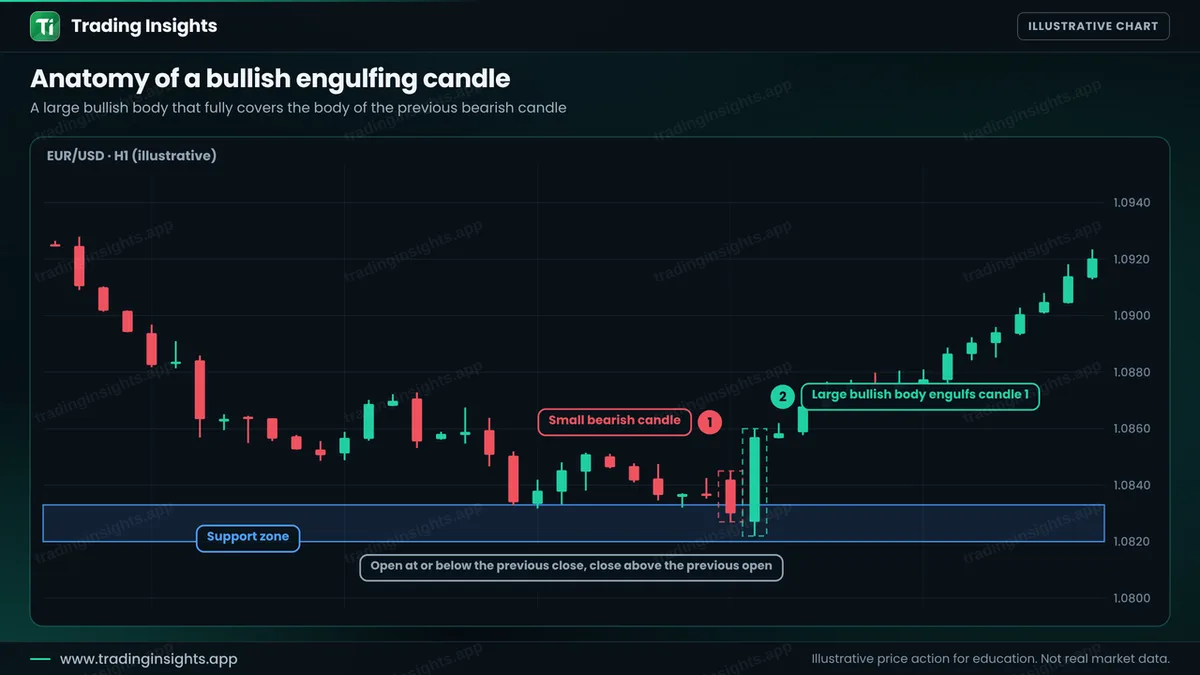
The bearish engulfing candle is the opposite: after a rise, a large bearish body covers the body of the previous bullish candle. You can read more about other patterns in candlestick patterns for beginners.
Location matters more than shape
A candle pattern by itself has little edge, because it appears everywhere. What gives it meaning is the context: a support or resistance level, a zone, or the end of a pullback in a trend. The same candle can be a good setup or just noise.
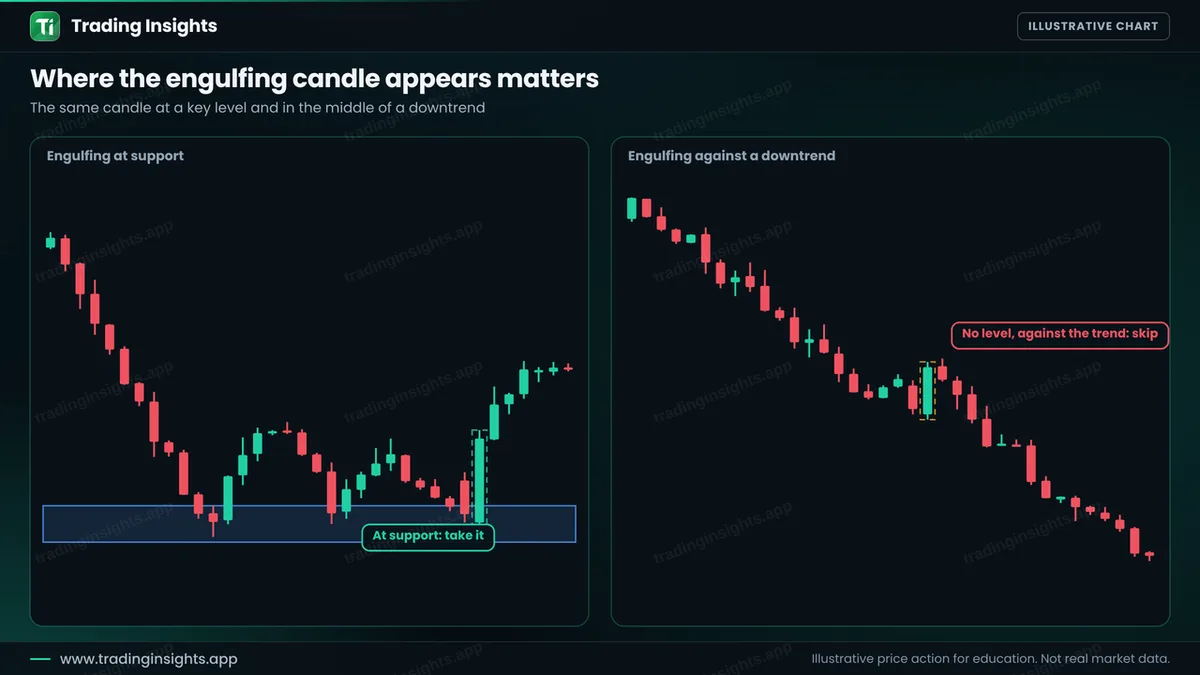
On the left, the candle forms at a zone where price has already turned several times. On the right, it forms in a strong downtrend, with no level, and price keeps falling. When you see an engulfing candle, ask three questions: is it at a level that matters, is it in line with the higher-timeframe trend or the end of a pullback, and is there room to the next opposing level? For levels, see support and resistance vs supply and demand zones.
The rules, step by step
- Mark the level first. Support or resistance, or a pullback area in a trend.
- Wait for the pattern to close. The second candle must be complete. A candle that looks engulfing at the middle of the hour may change by the close.
- Check the size. The engulfing candle should be clearly larger than the average candle. A tiny engulfing candle is weak.
- Enter after the close. At the close of the engulfing candle, or on a small pullback.
- Place the stop. Beyond the low of the engulfing candle for a buy, or beyond its high for a sell, with a small buffer.
- Set the target. A multiple of the risk, such as 2R, or the next level.
A worked trade
This is an illustrative buy on EUR/USD, H1. Price falls to a support zone near 1.0820 to 1.0833, and a bullish engulfing candle closes at 1.0857. You buy at the close, place the stop two pips below the low of the candle at 1.0820, and target twice the risk.
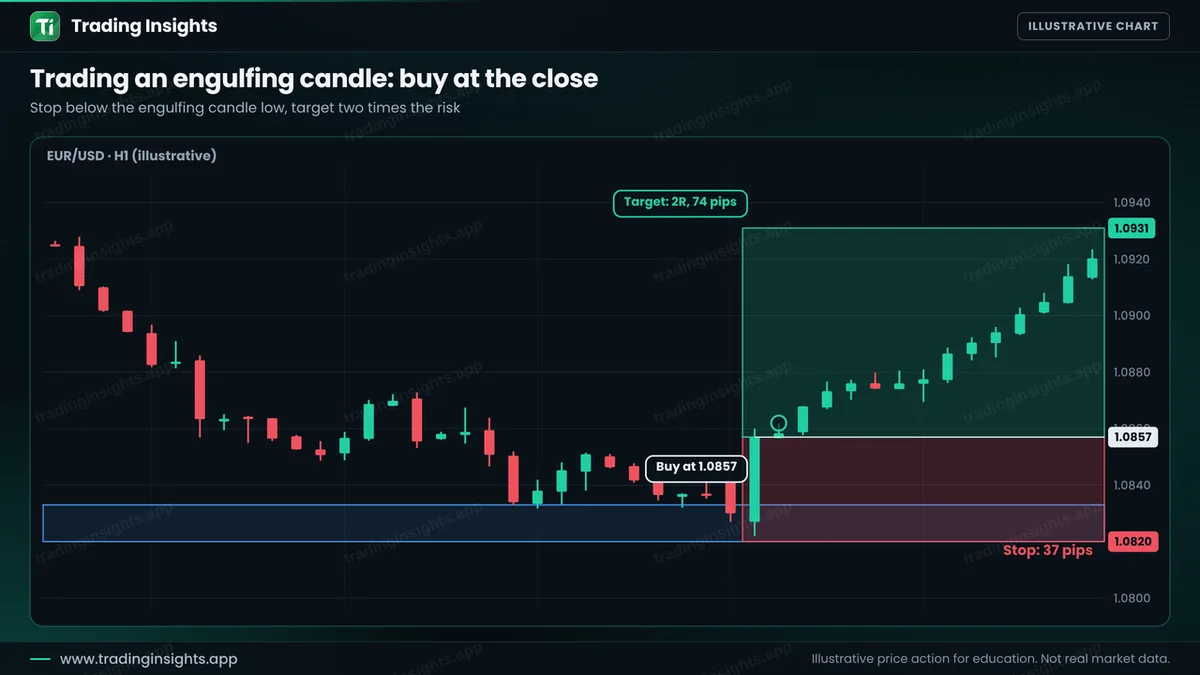
- Entry: 1.0857, at the close of the engulfing candle.
- Stop loss: 1.0820, below the candle low (37 pips).
- Take profit: 1.0931 (74 pips), a ratio of 1:2.
With a $10,000 account risking 1% ($100), the size is $100 / (37 pips x $10 per pip per lot) = about 0.27 lot. A win pays about $200, and a loss costs about $100. Because the engulfing candle is large, the stop is wide, and this is why the size is small. Use the position size calculator for your own account. For more on stops and targets, see stop loss and take profit.
Common mistakes
- Trading every engulfing candle without checking the level.
- Entering before the candle has closed.
- Using a tiny engulfing candle as a signal.
- Selling a bearish engulfing candle in a strong uptrend with no resistance.
- Forgetting that a large candle means a wide stop and a smaller position.
Frequently asked questions
What is a bullish engulfing candle?
It is a candle with a large bullish body that covers the whole body of the previous bearish candle, often seen at the end of a fall.
Is the engulfing pattern reliable?
It can help at key levels, but it fails often when it appears with no context. Test it on your own charts.
Do the wicks need to be engulfed?
Most traders look at the bodies only. Some use a stricter rule where the whole range of the previous candle is covered.
Which timeframe is best?
The pattern is more meaningful on higher timeframes such as H4 and daily, because each candle represents more trading.
Trading involves risk. This is education, not financial advice. The charts are illustrative and not real market data. Trading carries risk, and no method guarantees results.


