
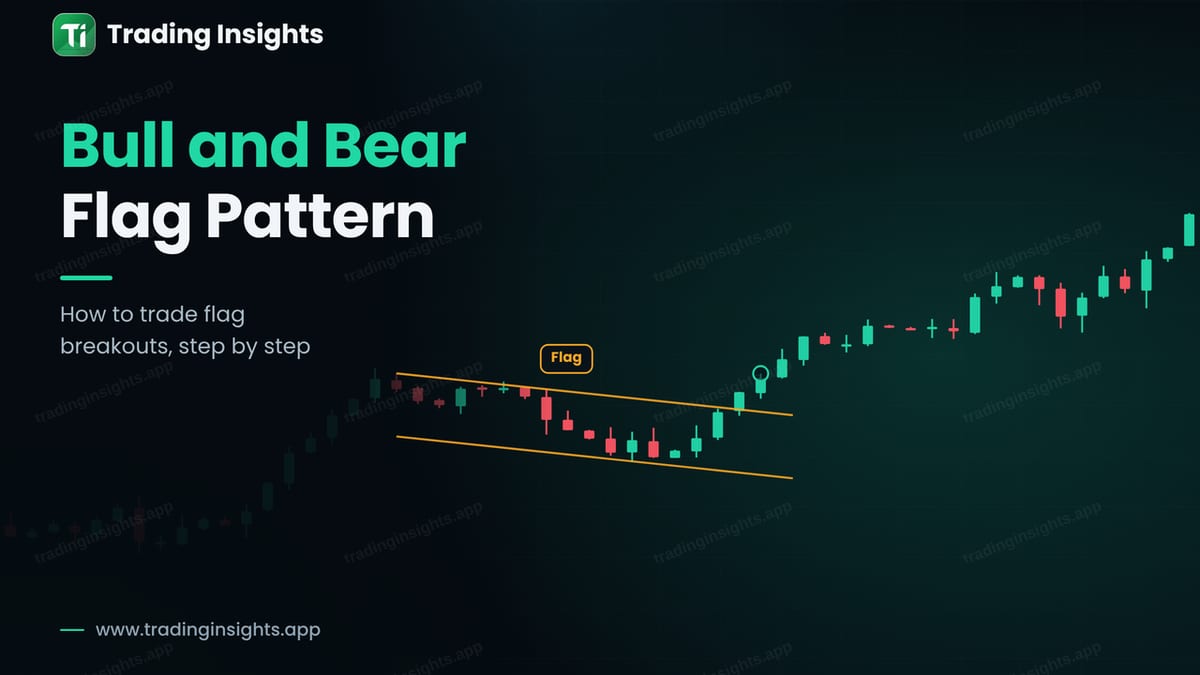
A flag is one of the most common continuation patterns. After a sharp move, price pauses in a small, slightly sloping channel, and then very often continues in the direction of the first move. The sharp move is called the flagpole, and the pause is the flag. In an uptrend the pattern is a bull flag, and in a downtrend it is a bear flag. This guide shows how to identify a flag, how to enter on the breakout, where to place the stop, how to set a target from the height of the pole, and what can go wrong. A flag is a probability and not a promise, so every trade needs a stop loss.
What a bull flag looks like
A bull flag has three parts. First comes the flagpole: a strong, fast rise with large candles and little pullback. Then comes the flag: a shallow pullback that drifts downward (or sideways) inside a small parallel channel, usually with smaller candles. Finally there is the breakout: a candle that closes above the upper line of the flag, which suggests that buyers are back in control.
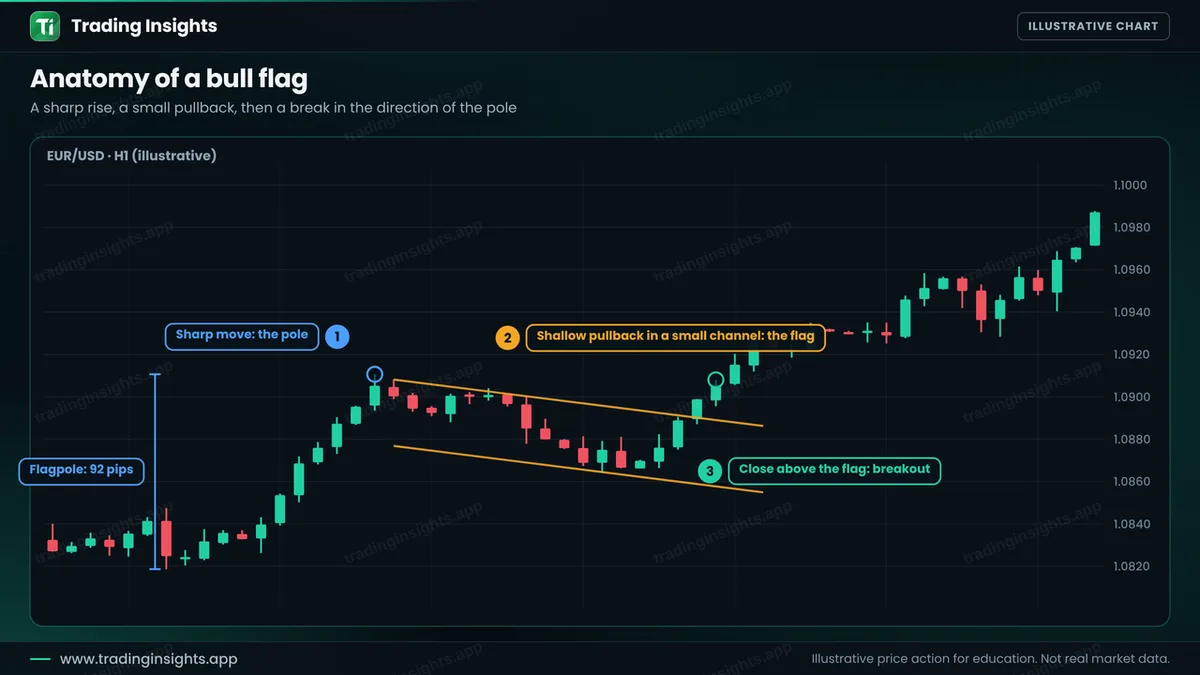
The logic is simple. The strong move shows that one side is dominant. The flag is a pause, where some traders take profit and others wait. If the pullback is shallow and orderly, it suggests that the dominant side has not given up. A deep, messy pullback that retraces most of the pole is a warning that it is not a flag. To read how structure supports the pattern, see what market structure is.
The bear flag is the mirror image
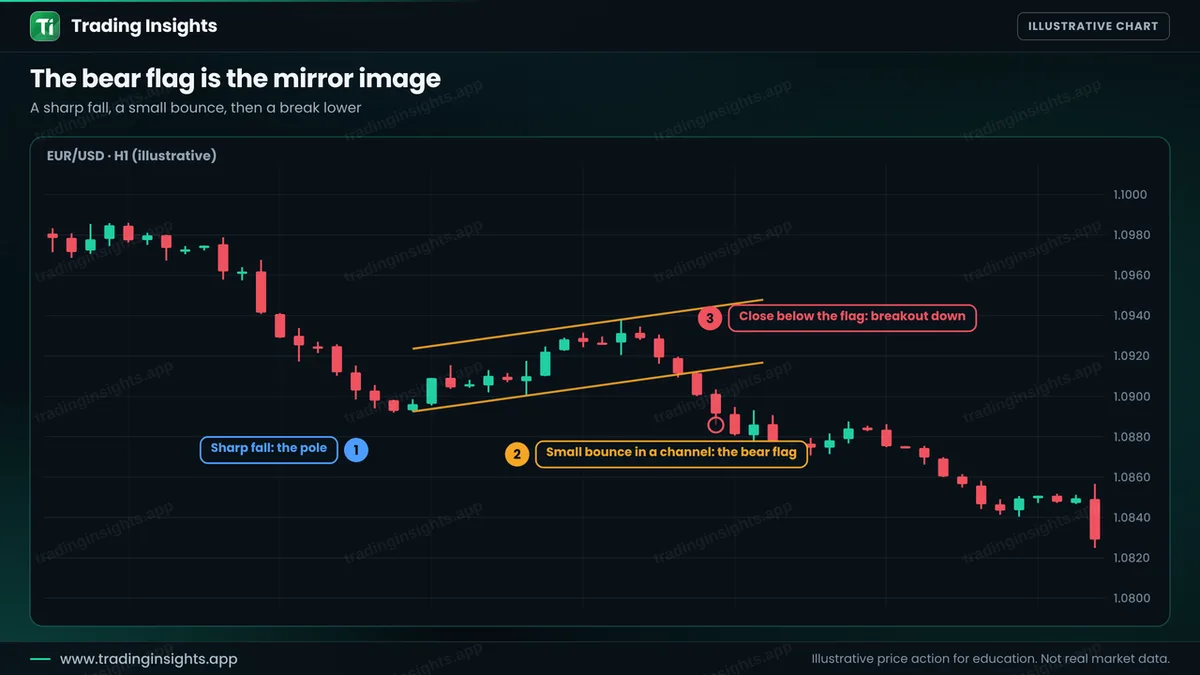
The bear flag turns everything upside down. The pole is a sharp fall, the flag is a small bounce that drifts up or sideways, and the breakout is a close below the lower line. Sellers who sold the first move are joined by new sellers. The rules for entry, stop and target are the same, just in the other direction.
The rules, step by step
- Find a clear flagpole. A fast move with big candles. A slow grind is not a pole.
- Draw the flag. Two parallel lines around the pullback. It should be shallow, often retracing less than half of the pole, and it should last fewer candles than the pole took.
- Wait for the breakout. A candle must close beyond the line in the direction of the pole. A wick through the line is not enough.
- Place the stop. For a bull flag, below the lowest low of the flag with a small buffer. For a bear flag, above the highest high.
- Set the target. A common method is the measured move: add the height of the pole to the breakout point. Some traders take part of the profit earlier.
- Size the trade. From the stop distance and a fixed risk. See position sizing.
A worked trade
This is an illustrative buy on EUR/USD, H1. The flagpole is 92 pips. After the flag, a candle closes above the upper line at 1.0899. You buy there, place the stop below the flag low at 1.0861, and target the pole height, which gives 1.0991.
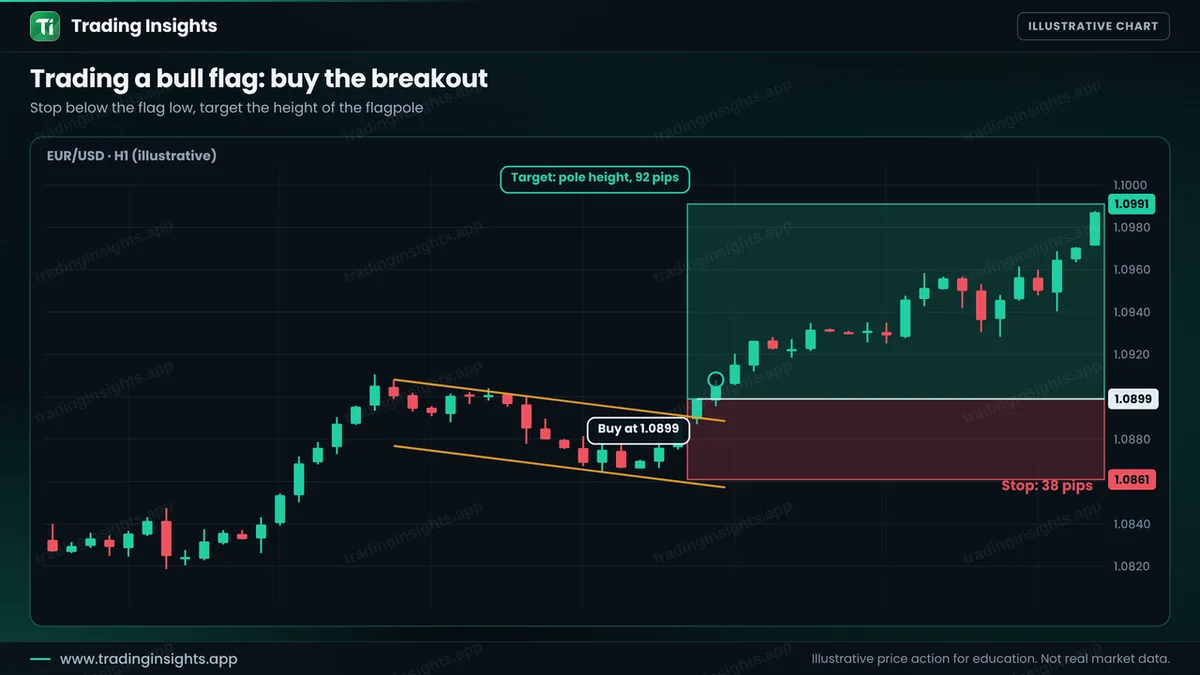
- Entry: 1.0899, after the close above the flag.
- Stop loss: 1.0861, below the flag low (38 pips).
- Take profit: 1.0991 (92 pips), a ratio of about 1:2.4.
With a $10,000 account risking 1% ($100), the position size is $100 / (38 pips x $10 per pip per lot) = about 0.26 lot. A win pays about $240, and a loss costs about $100. Check your own numbers with the position size calculator. If a trade reaches half of the target, you may move the stop to break-even. See trailing stop and break-even stop.
How to avoid the common failures
- Check the trend. A flag in the direction of the higher-timeframe trend has more support. See top-down analysis.
- Do not trade a deep pullback. If the flag retraces most of the pole, the pattern has failed.
- Beware of a fake break. Price can close beyond the flag and then return. See false breakouts.
- Test it. Mark at least 50 to 100 flags on past charts and record the results. See how to backtest a forex trading strategy.
Common mistakes
- Calling any small pullback a flag, even after a slow move.
- Entering before the breakout candle closes.
- Putting the stop inside the flag where normal noise reaches it.
- Expecting the full measured move on every trade.
- Ignoring a breakout that comes in the opposite direction.
Frequently asked questions
What is a bull flag in trading?
It is a continuation pattern in an uptrend: a sharp rise (the pole) followed by a small, shallow pullback in a channel (the flag), and then a breakout upward.
How long should a flag last?
Usually it is shorter than the pole, often a few candles to about twenty. If it runs on for much longer, it may be turning into a range.
What is the difference between a flag and a pennant?
A flag pauses in a parallel channel, while a pennant pauses in a small triangle that converges. The trading logic is the same.
Do flag patterns always work?
No. A flag can fail, and price can reverse. That is why the stop loss is placed beyond the flag.
Trading involves risk. This is education, not financial advice. The charts are illustrative and not real market data. Trading carries risk, and no method guarantees results.


