
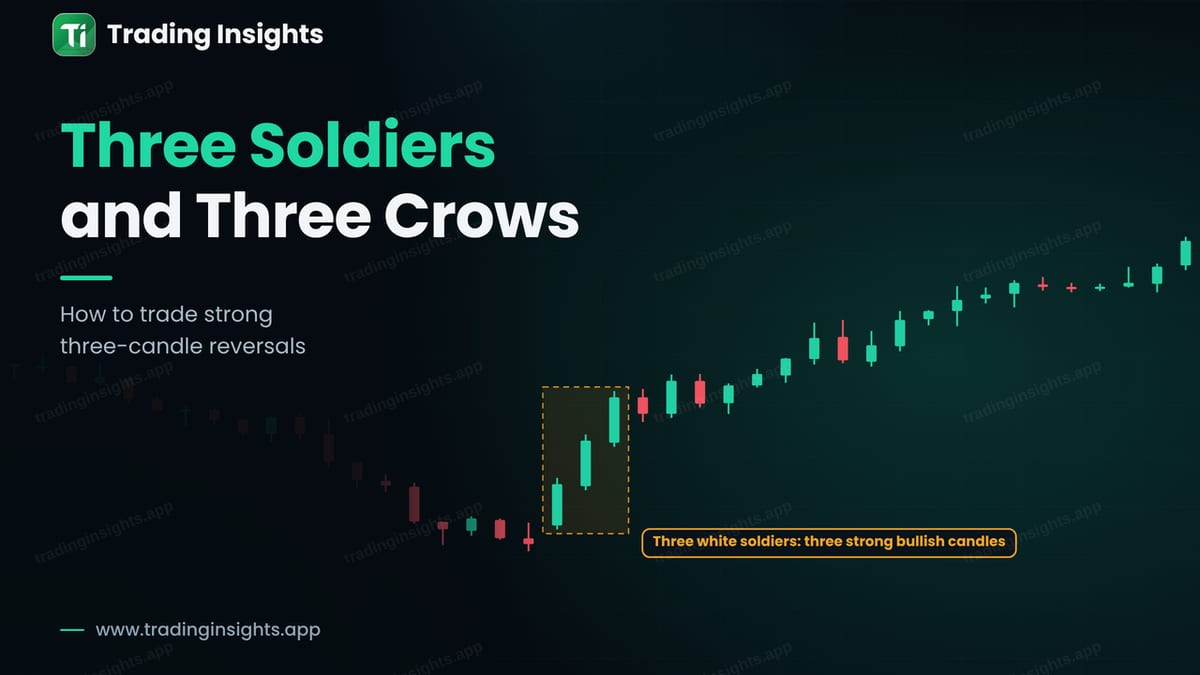
Most candlestick patterns show doubt. These two show strength. Three white soldiers are three strong bullish candles in a row. Three black crows are three strong bearish candles in a row. Each candle closes beyond the last one, so one side is clearly in control. When they appear after a long move in the other direction, they can mark the start of a turn.
What the patterns look like
For three white soldiers, look for three bullish candles after a downtrend. Each one opens inside the body of the previous candle, or near its close, and closes at a new high. The bodies are large and the wicks are small, especially the upper wick. Three black crows are the mirror image after an uptrend: three bearish candles, each closing lower, with small lower wicks.
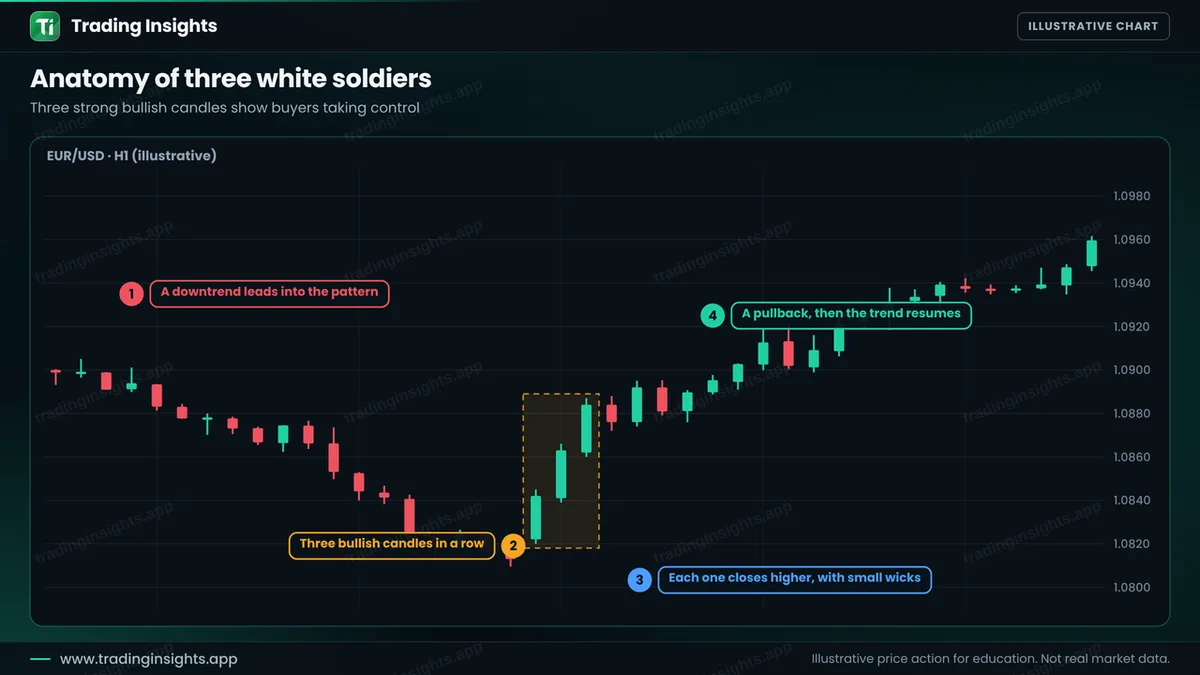
The logic is simple. If buyers are strong enough to win three candles in a row, sellers have lost control, at least for now. But a fast move can also be a fast trap, which is why the details below matter.
A strong set and a weak set
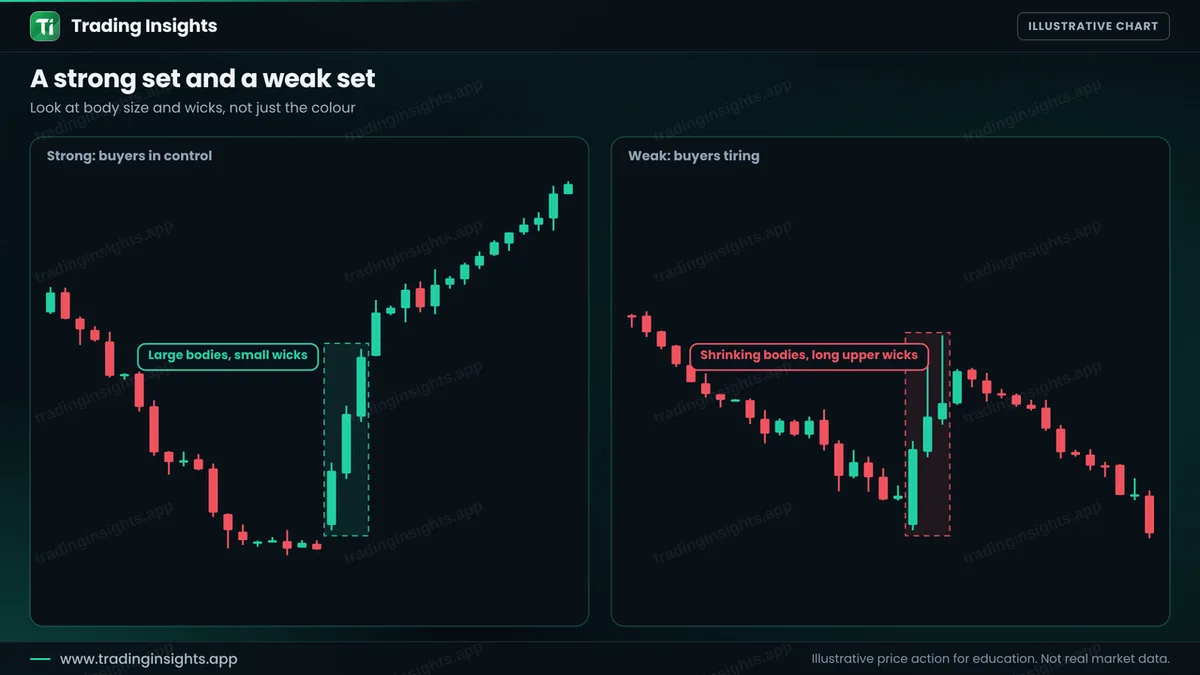
The weak set looks similar at first, as three green candles. But the bodies get smaller, and the upper wicks get longer. That means sellers are pushing back at higher prices. The move is tiring, and the pattern often fails. A strong set has large bodies and small wicks, which shows steady buying. See also candlestick patterns for beginners and the morning and evening star, which are three-candle reversals of a different kind.
The rules, step by step
- Find a clear prior move. Soldiers need a downtrend, and crows need an uptrend.
- Check the three candles. Large bodies, small wicks, and each close beyond the last.
- Do not chase. After three big candles, price is often stretched.
- Wait for a pullback. A small pullback and a candle that resumes the direction is a cleaner entry.
- Place the stop. Below the low of the third candle for soldiers, above the high of the third for crows.
- Set the target. Twice the risk, or the next level.
A worked trade
This is an illustrative buy on EUR/USD, H1. After a decline, three strong bullish candles form. Price pulls back slightly, and then a bullish candle closes at 1.0892. You buy there, place the stop below the low of the third candle at 1.0858, and target twice the risk at 1.0960.
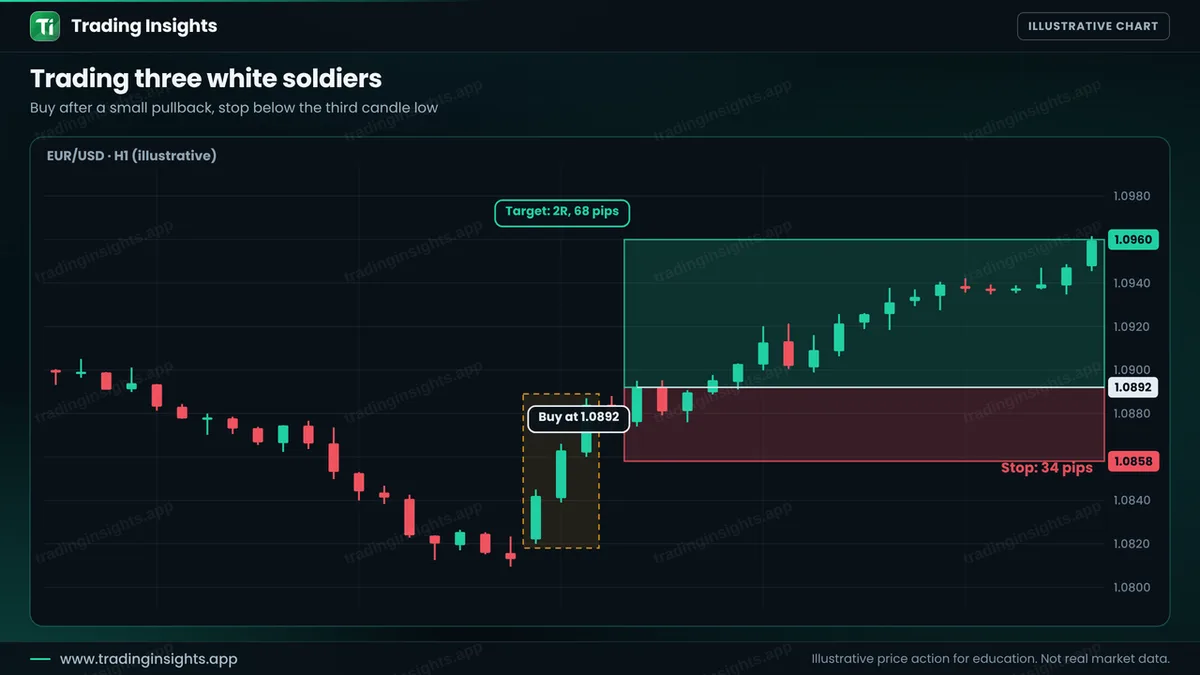
- Entry: 1.0892, after the pullback candle.
- Stop loss: 1.0858, below the third candle low (34 pips).
- Take profit: 1.0960 (68 pips), a ratio of 1:2.
With a $10,000 account risking 1% ($100), the position size is $100 / (34 pips x $10 per pip per lot) = about 0.29 lot. A win pays about $200, and a loss costs about $100. Check your own numbers with the position size calculator. Entering after the pullback keeps the stop smaller than if you had bought at the close of the third candle. For more on stops, see trailing and break-even stops.
How to avoid the common failures
- Avoid exhaustion. If the three candles reach a strong resistance, the move may end there. See support and resistance.
- Check for news. Three candles caused by a news release are different from steady buying. See trading forex news.
- Do not trade a weak set. Shrinking bodies and long wicks are a warning.
- Use the timeframe. The pattern on H4 or daily is more meaningful than on M1.
- Test it. See how to backtest.
Common mistakes
- Buying at the close of the third candle after a huge move.
- Ignoring long upper wicks.
- Using the pattern in the middle of a range.
- Placing the stop inside the three candles.
- Expecting a full reversal every time.
Frequently asked questions
What are three white soldiers?
They are three strong bullish candles in a row, each closing higher than the last, usually after a downtrend.
What are three black crows?
They are three strong bearish candles in a row, each closing lower than the last, usually after an uptrend.
Is it a reversal or a continuation pattern?
Usually it is a reversal when it follows a long move in the other direction. It can also confirm a continuation after a pause.
Should I enter at the close of the third candle?
Many traders prefer to wait for a small pullback, because the third candle often leaves price stretched and the stop wide.
Trading involves risk. This is education, not financial advice. The charts are illustrative and not real market data. Trading carries risk, and no method guarantees results.


