
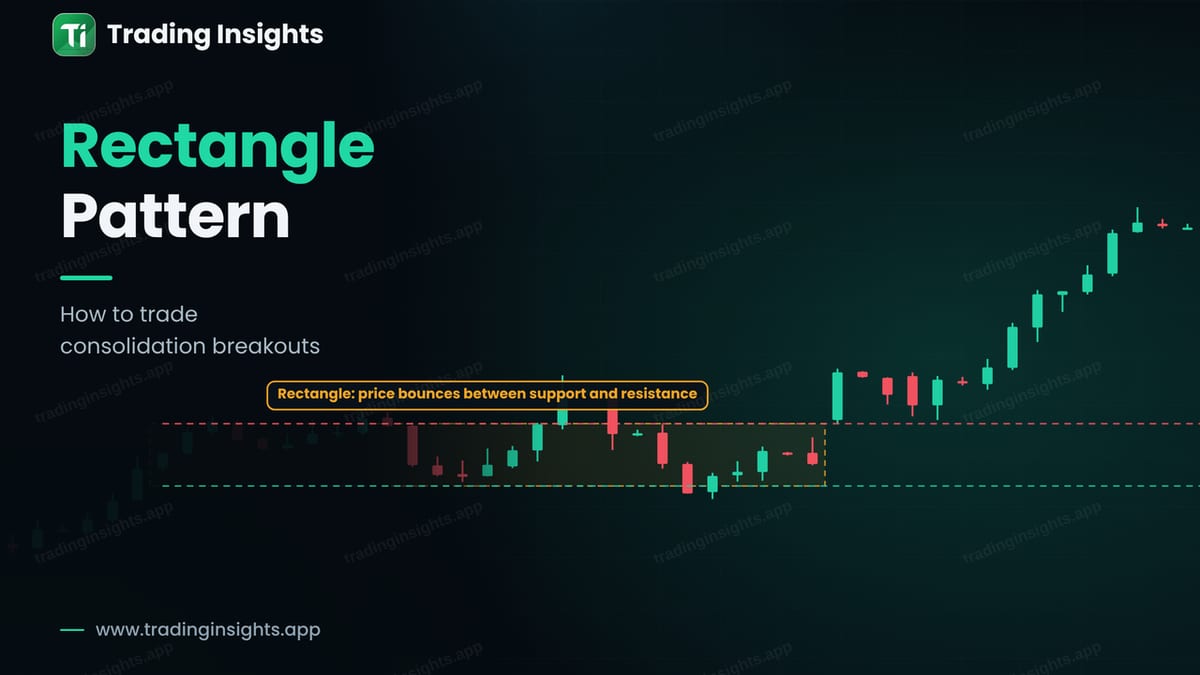
Markets do not always trend. Often price moves sideways for a while, bouncing between a floor and a ceiling. When you draw lines on these two levels, you get a rectangle. It is one of the simplest chart patterns, and it gives you clear levels for both an entry and a stop.
What a rectangle looks like
A rectangle has a flat top (resistance) and a flat bottom (support). Price touches the top, turns down, touches the bottom, and turns up again. You need at least two touches on each side. The more touches, the more traders watch the levels. The pattern shows a balance between buyers and sellers, and the balance ends when one side wins.
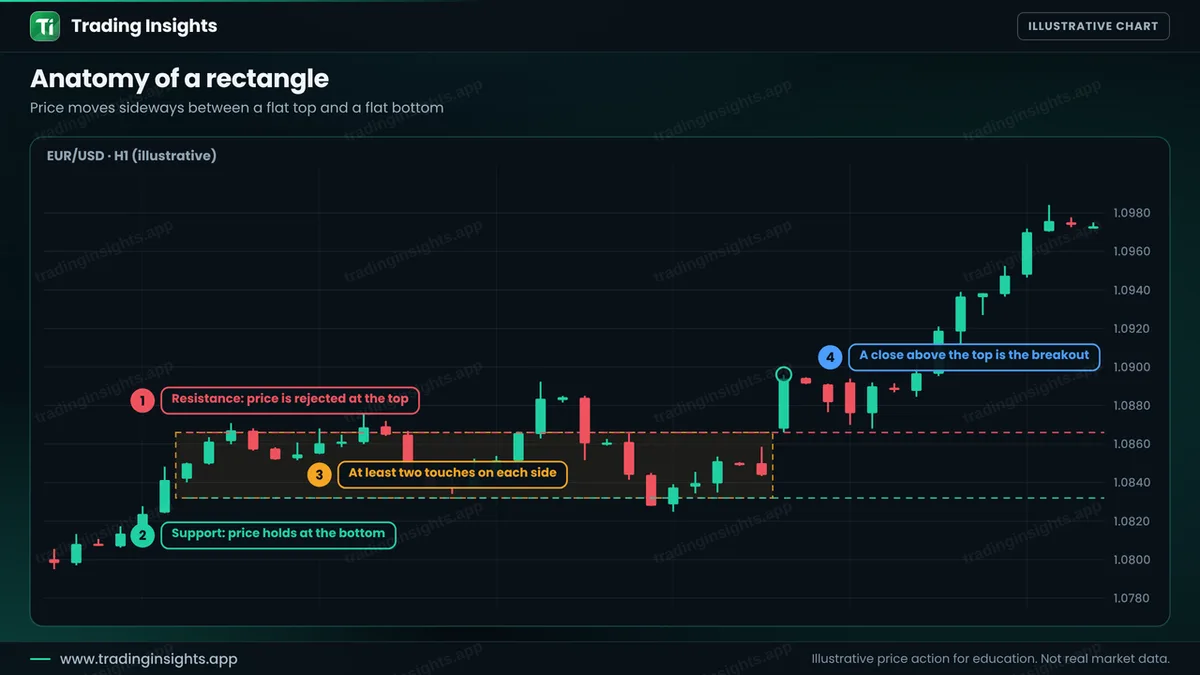
A rectangle can appear in an uptrend as a pause, and then it is a continuation pattern. It can also appear at the top or bottom of a move as a reversal. You cannot know in advance, so you trade the break, not the guess. If you trade the bounces inside, see range trading.
A breakout that holds and one that fails
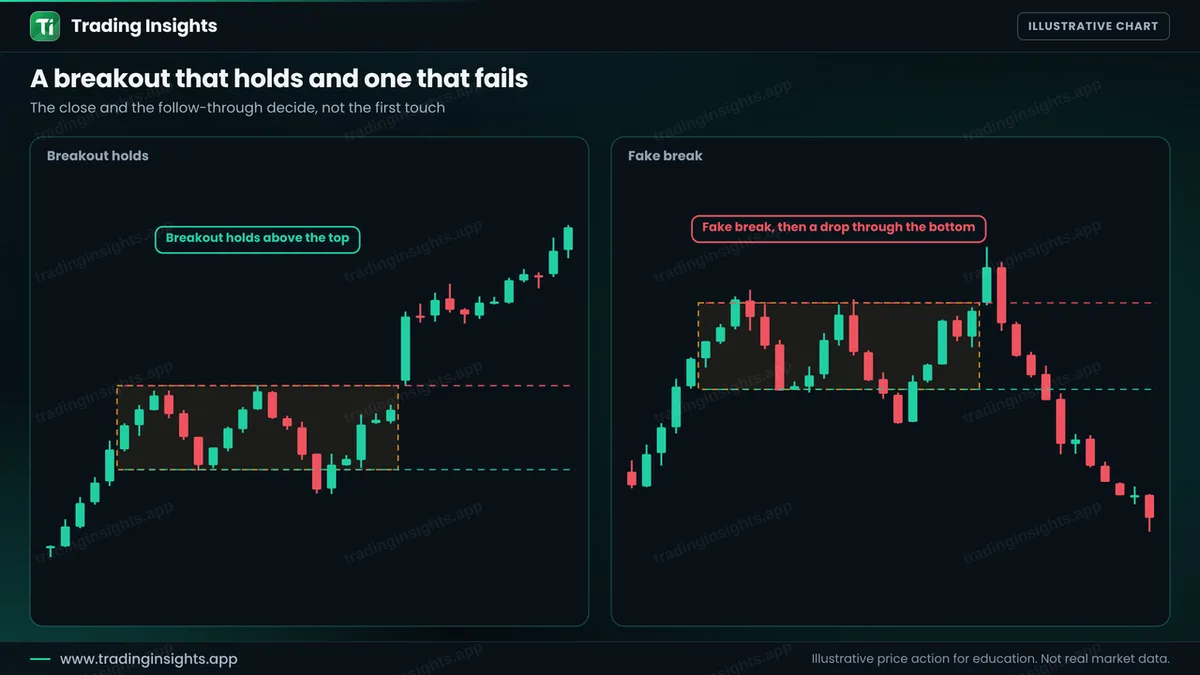
Fake breaks are common near the edges of a rectangle, because many stops are placed there. A close beyond the level helps, and a retest helps more. If price comes back to the broken level and holds, the old resistance has become support. See break and retest and false breakouts.
The rules, step by step
- Draw the rectangle. At least two touches on the top and two on the bottom.
- Wait for a close outside. A wick is not a break.
- Wait for the retest. Price returns to the broken level and holds.
- Enter on the bounce. A bullish candle at the retest for a buy.
- Place the stop. Back inside the rectangle, below the old top with a buffer. If price returns that far, the break has failed.
- Set the target. Twice the risk, or the height of the rectangle projected from the break, whichever is further and realistic.
A worked trade
This is an illustrative buy on EUR/USD, H1. A rectangle forms between 1.0832 and 1.0866. A strong candle closes above the top, price pulls back to the level and holds, and a bullish candle closes at 1.0890. You buy there, place the stop inside the rectangle at 1.0850, and target twice the risk at 1.0970.
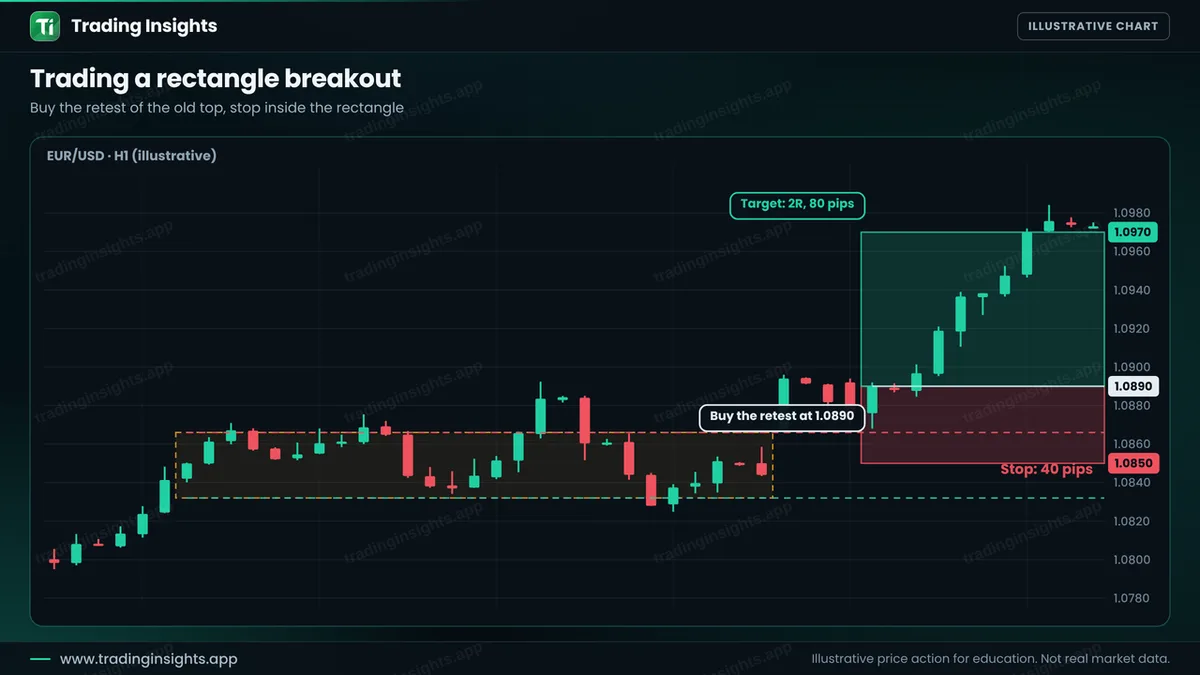
- Entry: 1.0890, after the retest.
- Stop loss: 1.0850, back inside the rectangle (40 pips).
- Take profit: 1.0970 (80 pips), a ratio of 1:2.
With a $10,000 account risking 1% ($100), the position size is $100 / (40 pips x $10 per pip per lot) = about 0.25 lot. A win pays about $200, and a loss costs about $100. Check your own numbers with the position size calculator. The height of this rectangle is only 34 pips, so a pure measured move would reach just 1.0900. That is a poor target for this entry, so here the 2R target is used. Always check that the target makes sense with the nearby levels.
How to avoid the common failures
- Do not draw it too early. Two touches are a minimum. Wait for the shape.
- Avoid tiny rectangles. If the range is only a few pips, the spread and noise dominate.
- Look at the trend. A break in the direction of the larger trend is usually safer. See how to identify a trend.
- Be careful around news. See trading forex news.
- Test it. See how to backtest.
Common mistakes
- Entering at the first touch of the line outside the rectangle.
- Putting the stop so far inside that the ratio is poor.
- Forgetting that sideways markets can last longer than expected.
- Ignoring the height of the rectangle when choosing the target.
- Trading both sides at once.
Frequently asked questions
What is a rectangle pattern?
It is a chart pattern in which price moves sideways between a flat support and a flat resistance.
Is the rectangle a continuation or reversal pattern?
It can be either. It often shows a pause in a trend, but the direction of the break decides the outcome.
How do I set the target?
A common method is to project the height of the rectangle from the break. You can also use a fixed ratio or the next level. Use the one that gives a realistic target.
Should I trade the break or the retest?
The break gives a faster entry, and the retest gives a safer one. The retest can be missed if price does not come back.
Trading involves risk. This is education, not financial advice. The charts are illustrative and not real market data. Trading carries risk, and no method guarantees results.


