
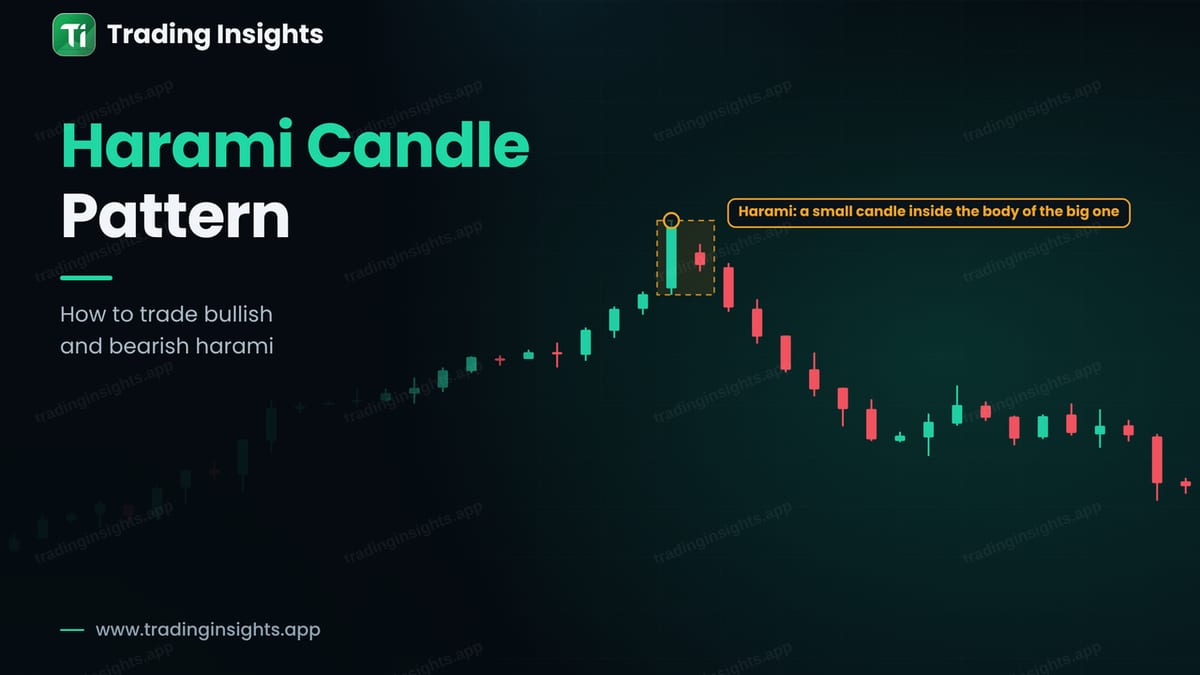
The word harami comes from Japanese and means pregnant. The pattern looks like a big candle carrying a small one inside its body. It has two candles, and it shows that a strong move has stopped growing. That alone is not a signal to trade, but together with the trend and a confirmation candle, it can warn that a turn is near.
What a harami looks like
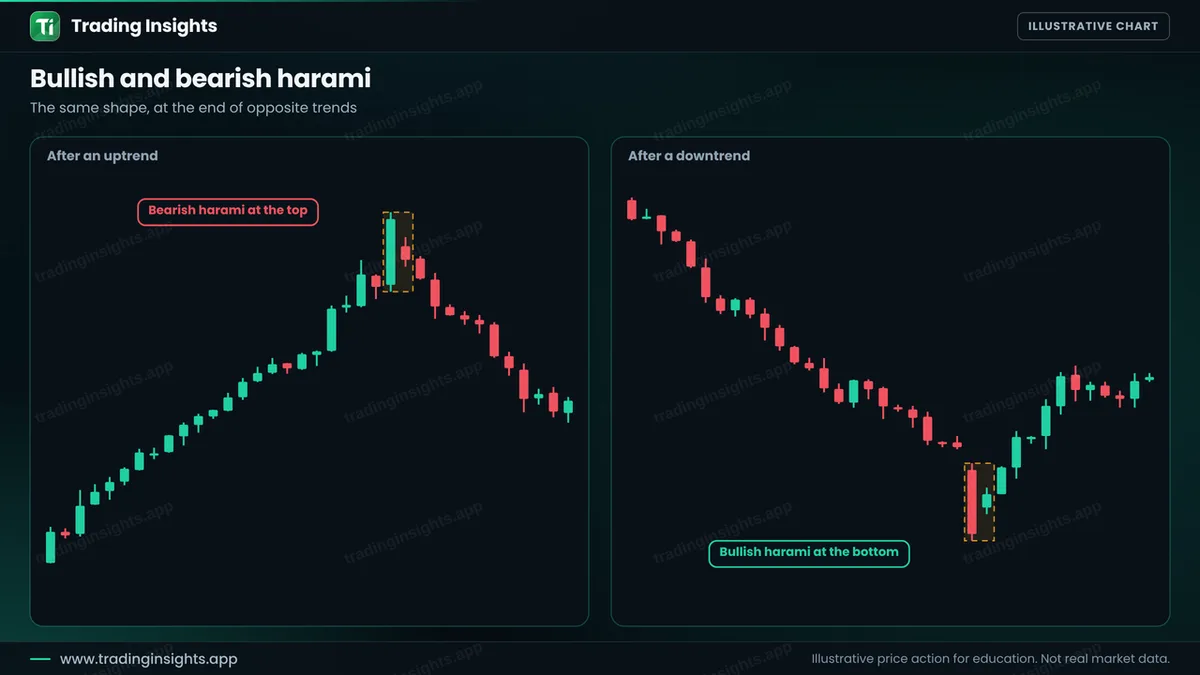
A bearish harami appears after an uptrend. The first candle is a large bullish candle. The second candle is small, and its body sits inside the body of the first. The market was strongly up, and now it is hesitating. A bullish harami is the opposite: it appears after a downtrend, with a large bearish candle first and a small candle inside it.
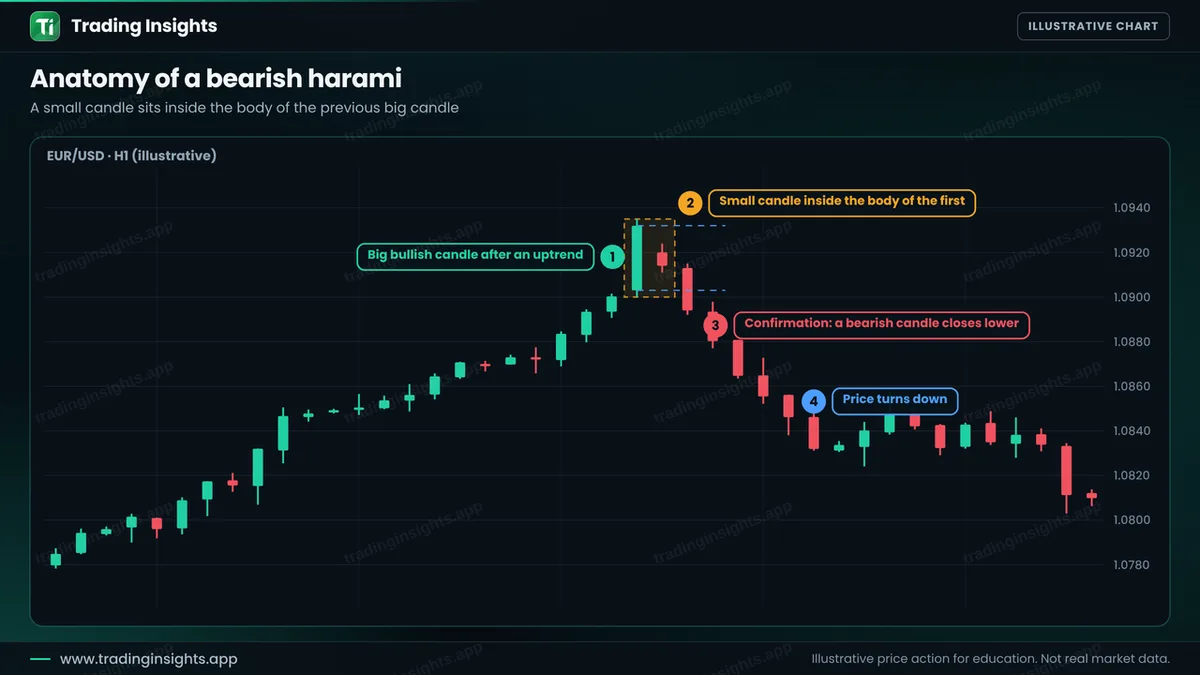
The small candle can be any colour. What matters is that its body stays inside the body of the first candle. Its wicks may go outside, but a perfect harami has them inside too.
Bullish and bearish harami
The location decides the meaning. A bearish harami in the middle of a range means little. At the end of a long rise, or near resistance, it carries more weight. Compare this with the engulfing candle, which is the opposite shape: there, the second candle covers the first. A harami is weaker, because it only shows a pause, not a change of control.
The rules, step by step
- Find the trend. You need a clear move before the pattern.
- Spot the big candle. It should be clearly larger than the recent candles.
- Spot the small candle inside. Its body is within the body of the big candle.
- Wait for the confirmation. For a bearish harami, wait for a bearish candle that closes below the small candle.
- Enter after the close of the confirmation candle.
- Place the stop. Above the high of the big candle, with a small buffer.
- Set the target. Twice the risk, or the next support level.
A worked trade
This is an illustrative sell on EUR/USD, H1. After a steady rise, a big bullish candle forms, and a small candle follows inside its body. The next candle closes lower at 1.0894. You sell there, place the stop above the big candle high at 1.0937, and target twice the risk at 1.0808.
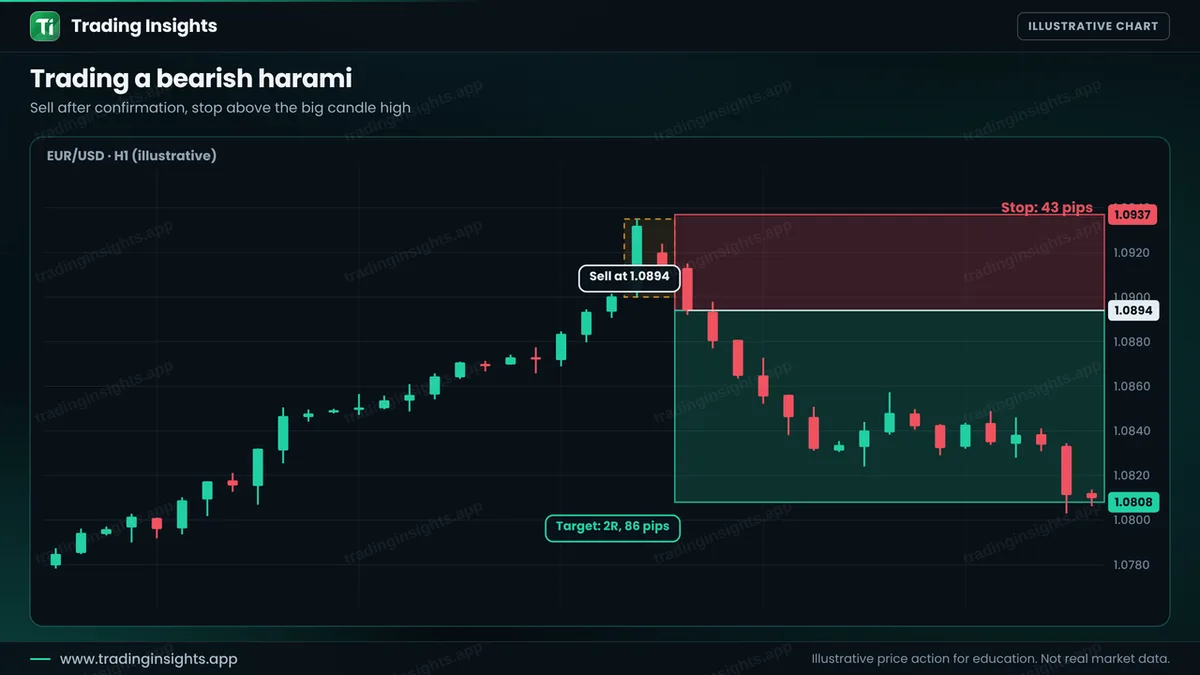
- Entry: 1.0894, after the bearish confirmation.
- Stop loss: 1.0937, above the big candle high (43 pips).
- Take profit: 1.0808 (86 pips), a ratio of 1:2.
With a $10,000 account risking 1% ($100), the position size is $100 / (43 pips x $10 per pip per lot) = about 0.23 lot. A win pays about $200, and a loss costs about $100. Check your own numbers with the position size calculator. A big first candle makes the stop wide. If it is too wide, skip the trade instead of making the stop smaller.
How to avoid the common failures
- Do not trade it alone. A harami is a weak signal. Add a level or a trend line. See candlestick patterns for beginners.
- Wait for confirmation. Many haramis end with price continuing in the old direction.
- Check the size. A tiny first candle gives a meaningless pattern.
- Compare with other patterns. A doji inside a big candle is a harami cross, which shows even more hesitation.
- Test it. See how to backtest.
Common mistakes
- Calling any small candle after a big one a harami, even when it is outside the body.
- Entering on the small candle itself.
- Using a stop inside the big candle.
- Trading it in a sideways market.
- Ignoring the next candle after the pattern.
Frequently asked questions
What does harami mean in trading?
It means a small candle contained inside the body of the previous big candle. It shows a pause in the move.
Is a harami a reversal pattern?
It can warn of a reversal, but it is weak on its own. It needs a trend, a good location and a confirmation candle.
What is the difference between a harami and an engulfing candle?
In a harami the second candle is inside the first. In an engulfing pattern the second candle covers the first. Engulfing is usually considered stronger.
What is a harami cross?
It is a harami where the small candle is a doji, with the open and close almost equal.
Trading involves risk. This is education, not financial advice. The charts are illustrative and not real market data. Trading carries risk, and no method guarantees results.


