
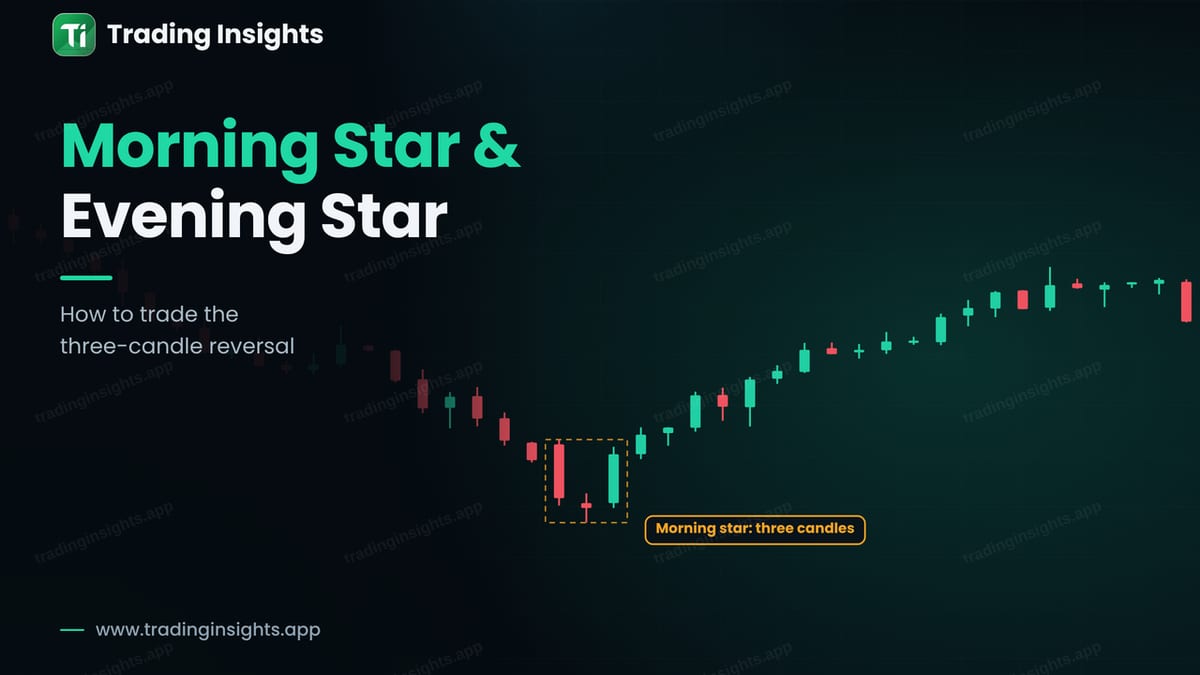
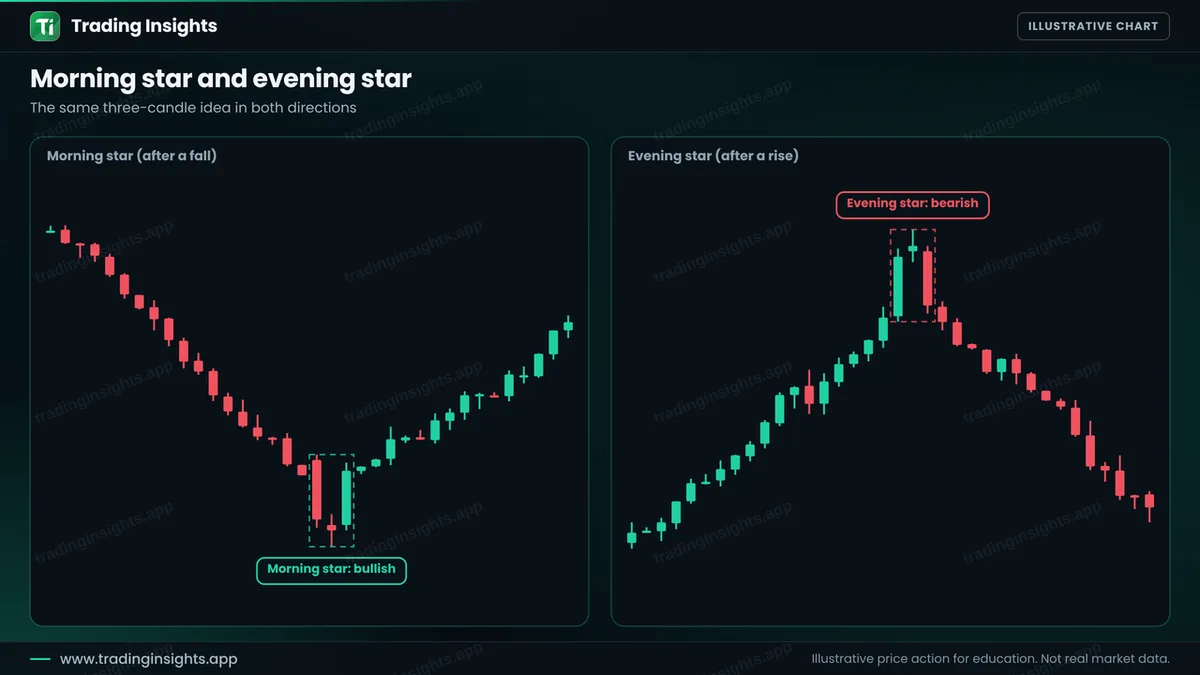
The morning star and the evening star are three-candle reversal patterns. They show a trend losing its force in three steps: a strong candle in the direction of the trend, a small candle that shows hesitation, and a strong candle in the opposite direction. The morning star appears after a fall and is bullish. The evening star appears after a rise and is bearish.
What a morning star looks like
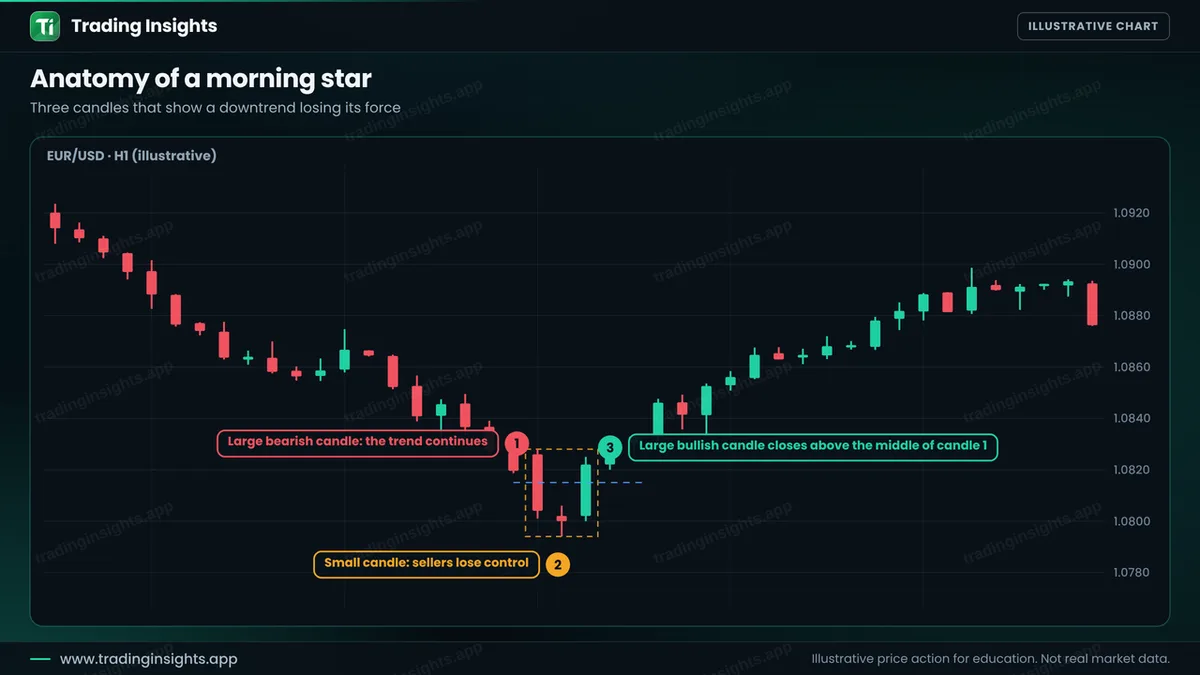
The pattern has three parts. The first candle is a large bearish candle that continues the downtrend. The second is a small candle, often a doji or a spinning top, which shows that sellers have lost control. The third is a large bullish candle that closes above the middle of the first candle. Together they tell a story: sellers pushed, then stopped, then buyers took over.
The name comes from the morning star (Venus), which appears before sunrise. The small middle candle is the star, and the dawn is the bullish candle that follows.
The evening star is the mirror image
The evening star appears at the top of a rise. The first candle is a large bullish candle, the second is a small candle, and the third is a large bearish candle that closes below the middle of the first. It warns that buyers are giving way to sellers. The rules for entry, stop and target are the same, just reversed.
The rules, step by step
- Find a clear trend. A fall for a morning star and a rise for an evening star. A pattern in a range means little.
- Check the three candles. Large, small, large. The third should close beyond the middle of the first.
- Look at the location. The best patterns appear at a support or resistance zone. See support and resistance.
- Enter after the third candle closes. Do not enter during the candle.
- Place the stop. For a morning star, below the low of the star candle with a small buffer. For an evening star, above its high.
- Set the target. A common choice is twice the risk, or the next level.
A worked trade
This is an illustrative buy on EUR/USD, H1. After a fall, a morning star forms with the star low at 1.0794. The third candle closes strongly, and the next candle closes at 1.0830. You buy there, place the stop below the star low at 1.0792, and target twice the risk, which is 1.0906.
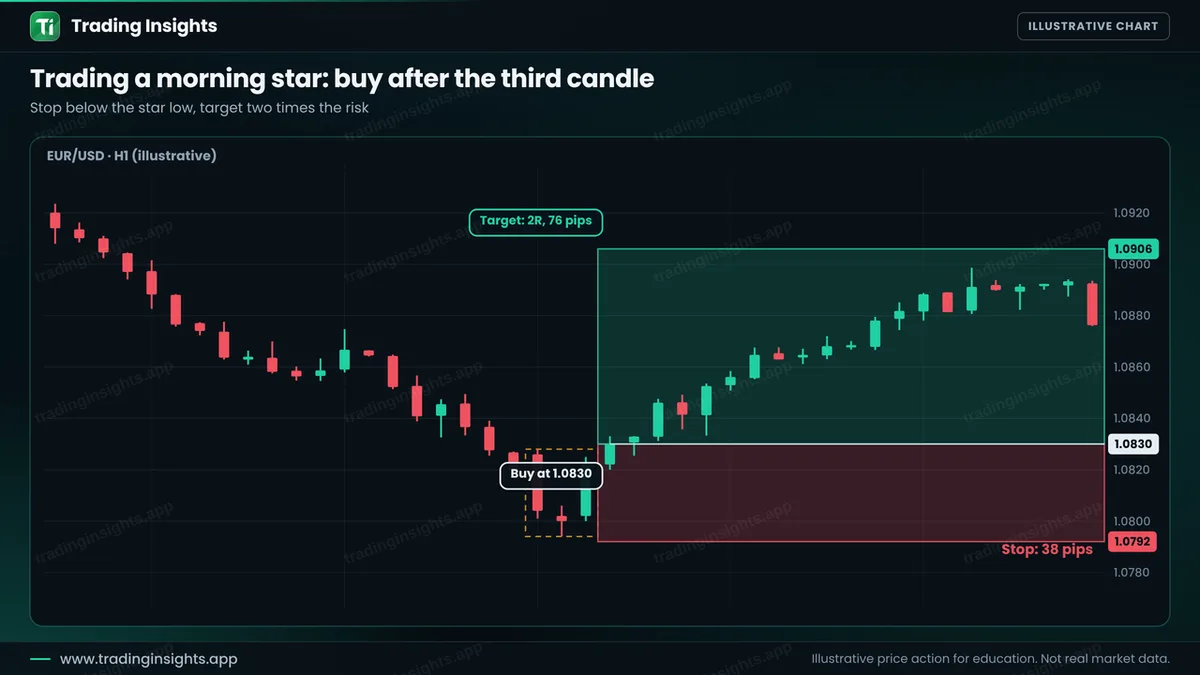
- Entry: 1.0830, after the pattern is complete.
- Stop loss: 1.0792, below the star candle low (38 pips).
- Take profit: 1.0906 (76 pips), a ratio of 1:2.
With a $10,000 account risking 1% ($100), the position size is $100 / (38 pips x $10 per pip per lot) = about 0.26 lot. A win pays about $200, and a loss costs about $100. Check your own numbers with the position size calculator. Because three candles make the pattern wide, the stop is also wide, so the size is small.
How to avoid the common failures
- Do not trade it everywhere. The pattern needs a trend before it and a level around it.
- Do not rush. Wait until the third candle closes. A third candle that is still open can turn into a different shape.
- Combine with other tools. A pattern at a Fibonacci level or a trend line is stronger. See Fibonacci retracement.
- Know the cousins. See the doji candle and the engulfing candle.
Common mistakes
- Calling any three candles a star pattern.
- Ignoring the trend before the pattern.
- Entering before the third candle closes.
- Putting the stop inside the pattern.
- Forgetting that the wide stop needs a smaller size.
Frequently asked questions
What is a morning star candlestick?
It is a three-candle bullish reversal pattern after a fall: a large bearish candle, a small candle, and a large bullish candle that closes above the middle of the first.
What is the difference between a morning star and an evening star?
A morning star is bullish and appears after a fall. An evening star is bearish and appears after a rise.
Does the middle candle need to be a doji?
No. It can be a doji or any small-bodied candle. A doji star is often seen as a stronger sign of indecision.
How reliable is the morning star?
No pattern is reliable on its own. It works better at a key level and in the direction of the higher-timeframe trend, with a stop loss.
Trading involves risk. This is education, not financial advice. The charts are illustrative and not real market data. Trading carries risk, and no method guarantees results.


