
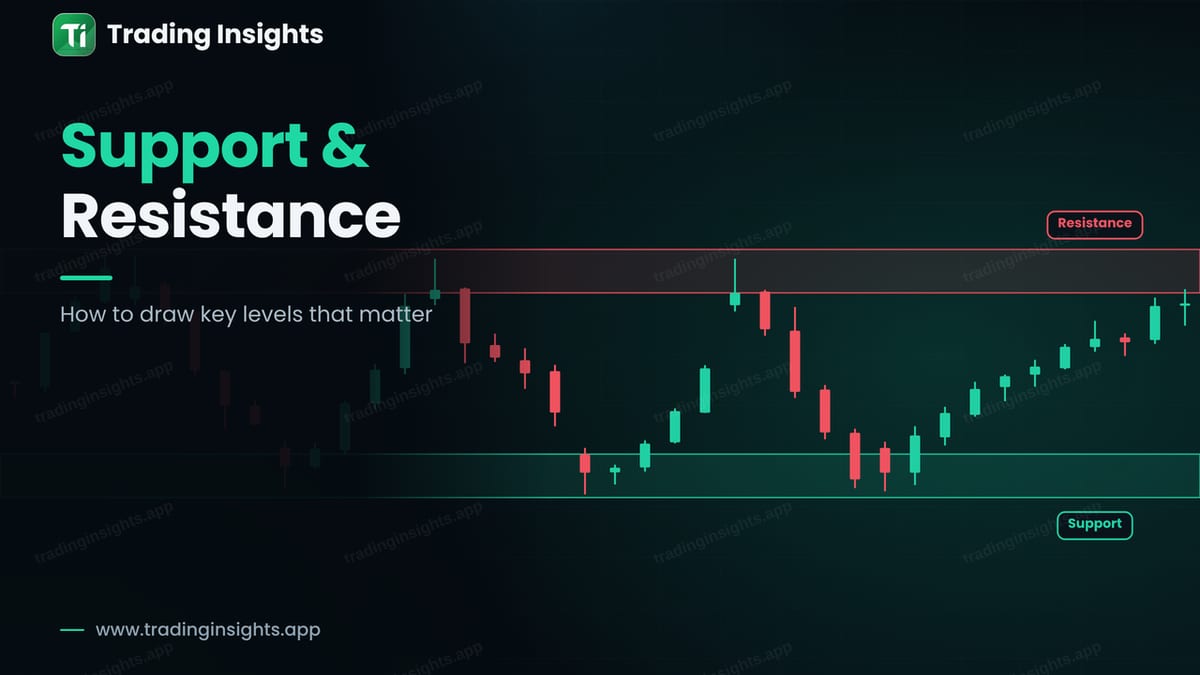
Support is an area where price has stopped falling and turned up. Resistance is an area where price has stopped rising and turned down. They are among the first tools every trader learns, because they show where buyers and sellers have acted before. The skill is not in knowing the words, but in drawing the levels well.
Why price turns at the same areas
When price falls to an area and bounces, some traders who missed the move wait for a return. Others who sold early place orders to buy back. When price returns, these orders meet it, and price may turn again. The same logic works at resistance, in the other direction. So a level is really a memory of past orders.
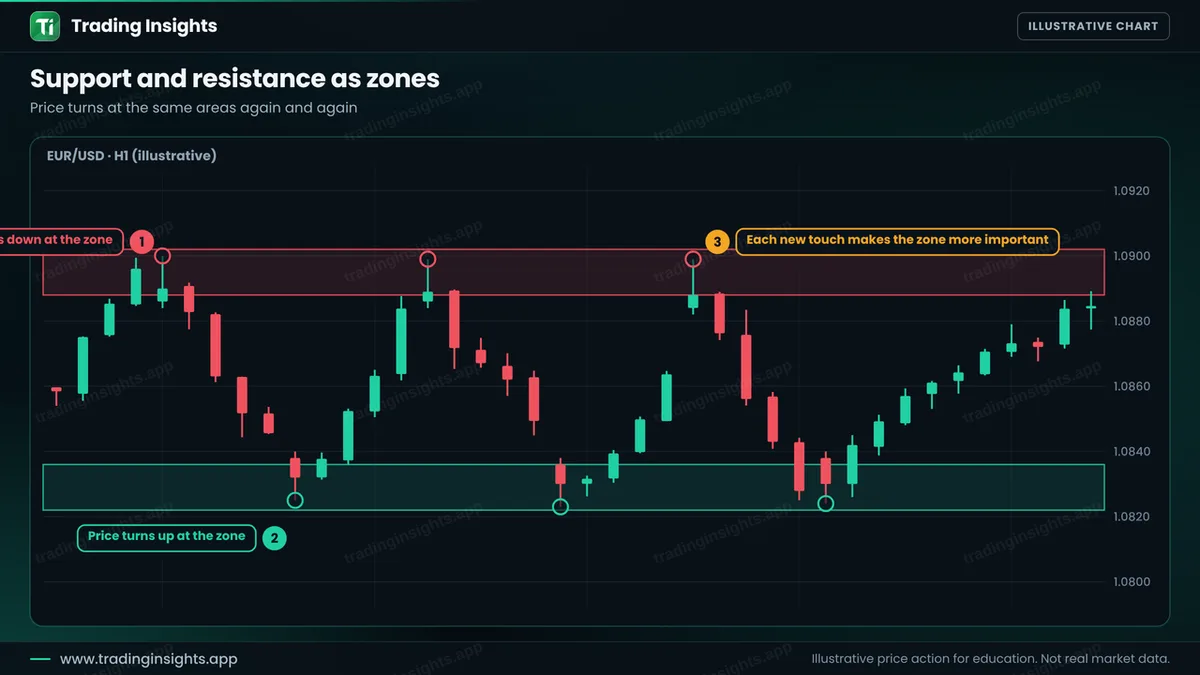
A level that has been touched three times is more important than one touched once. But there is a catch: the more times a level is tested, the more orders it uses up, so very old levels can fail. Treat the touches as a guide, not as a promise.
Draw zones, not thin lines
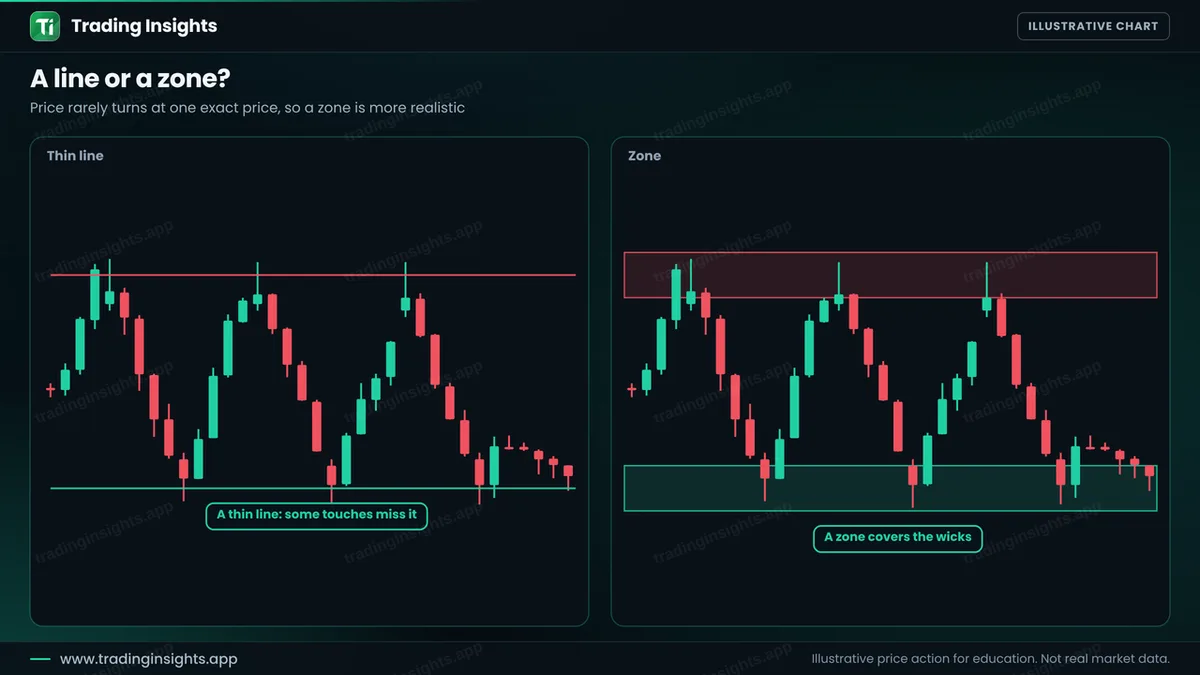
Price often pokes a few pips past a level before turning. If you draw a thin line, some touches will miss it and some will cut through it, and you will think the level has failed. A zone solves this. Draw the box from the lowest wick to the area where the bodies cluster. A zone of 10 to 15 pips on the H1 chart is common.
How to draw key levels, step by step
- Start on a higher timeframe. The H4 or daily chart shows the levels that most traders watch. See top-down analysis.
- Find the clear turns. Mark places where price reversed with a strong candle, not every small bounce.
- Draw a zone around them. Include the wicks, and let the zone be a little wider than a line.
- Count the touches. Two or three touches show that the level matters.
- Remove clutter. A chart with ten levels shows none. Keep the few that are closest to the current price.
A worked trade
This is an illustrative buy on EUR/USD, H1. Price has bounced from a support zone twice. On the third visit, a bullish candle closes at 1.0842. You buy there, place the stop below the zone at 1.0818, and target the bottom of the resistance zone at 1.0889.
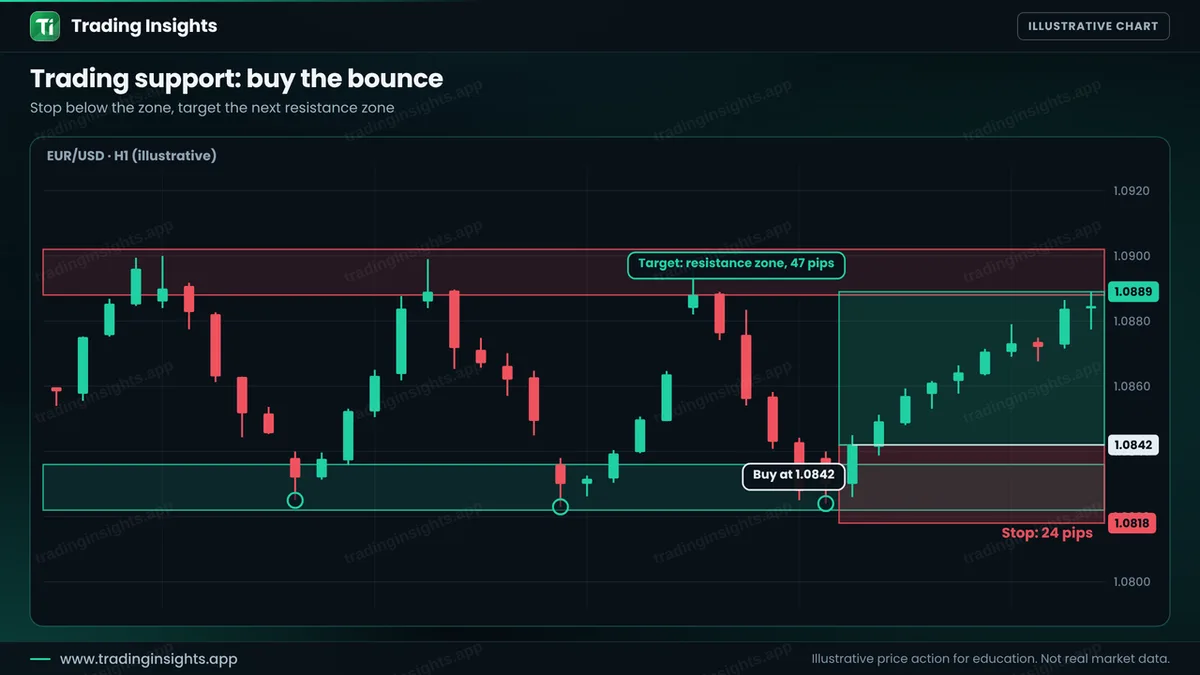
- Entry: 1.0842, after a bullish candle closes at the support zone.
- Stop loss: 1.0818, below the zone (24 pips).
- Take profit: 1.0889 (47 pips), a ratio of about 1:2.
With a $10,000 account risking 1% ($100), the position size is $100 / (24 pips x $10 per pip per lot) = about 0.42 lot. A win pays about $195, and a loss costs about $100. Check your own numbers with the position size calculator. For more on stops and targets, see stop loss and take profit.
What happens when a level breaks
Levels do not last forever. When price closes through a zone and holds, support can become resistance, and resistance can become support. This is the idea behind break and retest. If price pokes through and returns quickly, it may be a false breakout. For the related idea of supply and demand, see support and resistance vs supply and demand zones.
Common mistakes
- Drawing too many levels and trading all of them.
- Using thin lines and calling a level broken after a small wick.
- Buying at support with no confirmation and no stop.
- Placing the target right under the next level, and then complaining about missed profit.
- Trusting an old level that has been tested many times.
Frequently asked questions
What is support and resistance in forex?
Support is an area where price has stopped falling and turned up, and resistance is an area where price has stopped rising and turned down.
How many touches make a level valid?
Two or three touches are a common guide. More touches show importance, but also use up orders, so a level can weaken.
Is support and resistance a line or a zone?
A zone is more realistic. Price often goes a few pips beyond a level, so a thin line gives false breaks.
Which timeframe is best for drawing levels?
Start on a higher timeframe such as H4 or daily, then trade on a lower one. Higher-timeframe levels are watched by more traders.
Trading involves risk. This is education, not financial advice. The charts are illustrative and not real market data. Trading carries risk, and no method guarantees results.


