
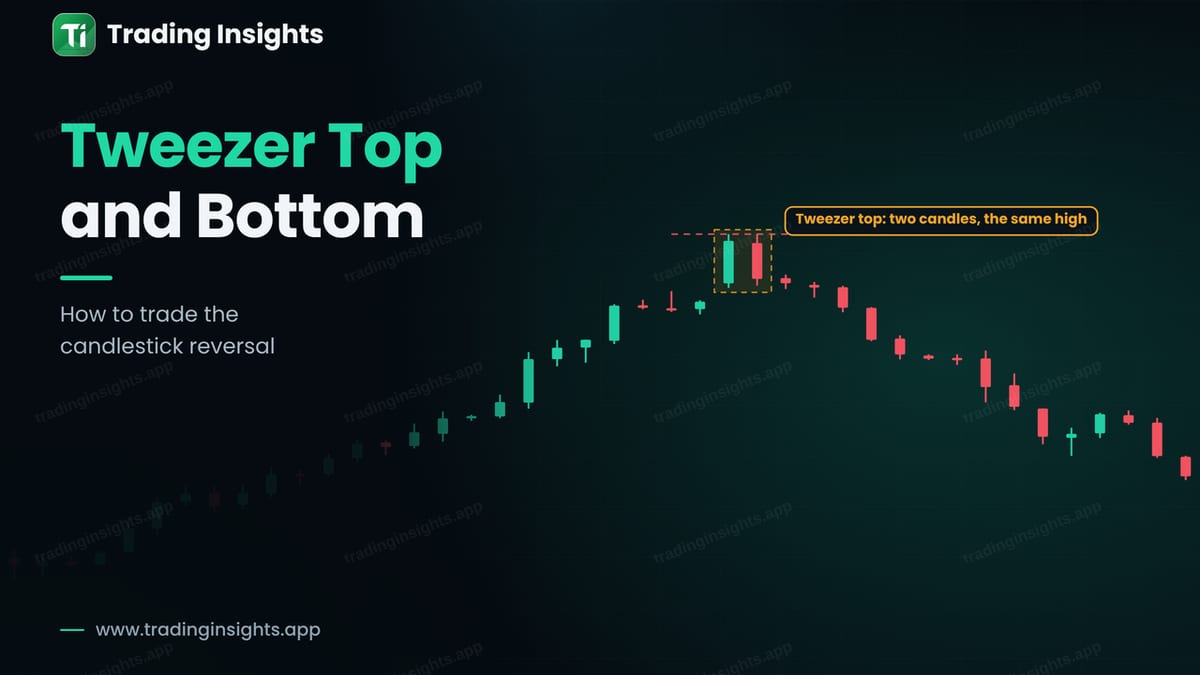
A tweezer pattern is made of two candles that have the same high or the same low, like the two prongs of tweezers. It is simple to see, and it shows something clear: the market tried to go to the same price twice and was rejected both times. At the end of a trend, that can be an early sign of a turn.
What a tweezer looks like
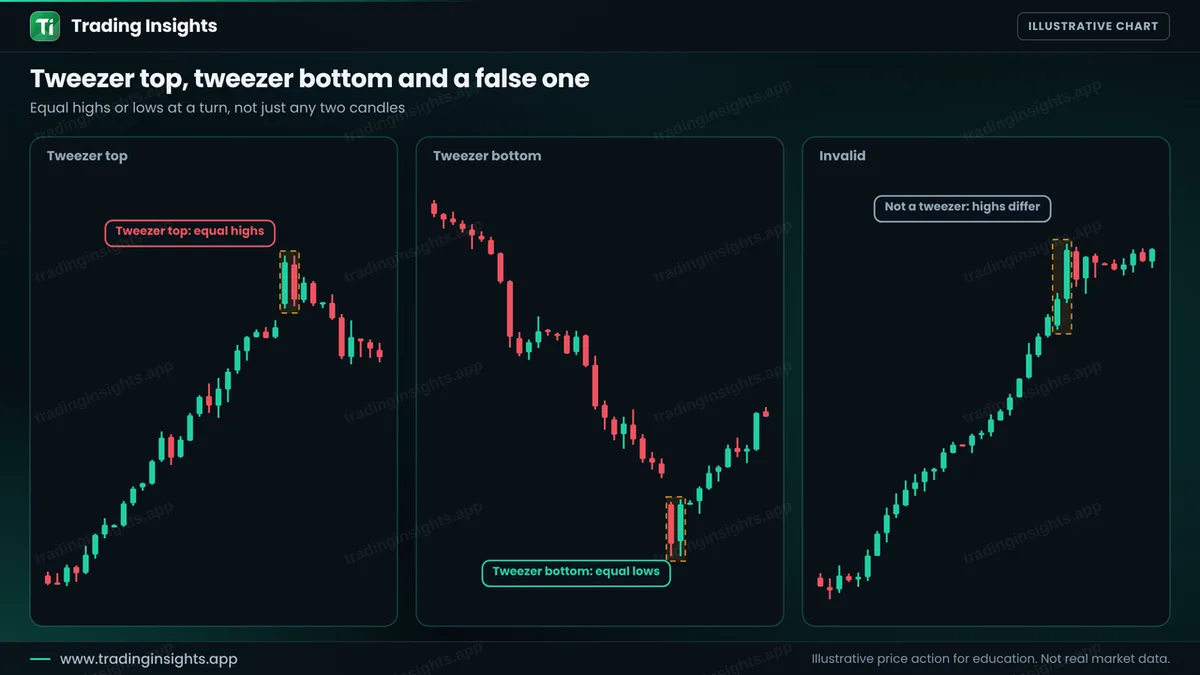
A tweezer top appears after an uptrend. The first candle is usually bullish, and the second is bearish, and they share almost the same high. Buyers pushed to that price twice, and sellers answered both times. A tweezer bottom is the opposite: after a downtrend, two candles share nearly the same low, and the second one is bullish.
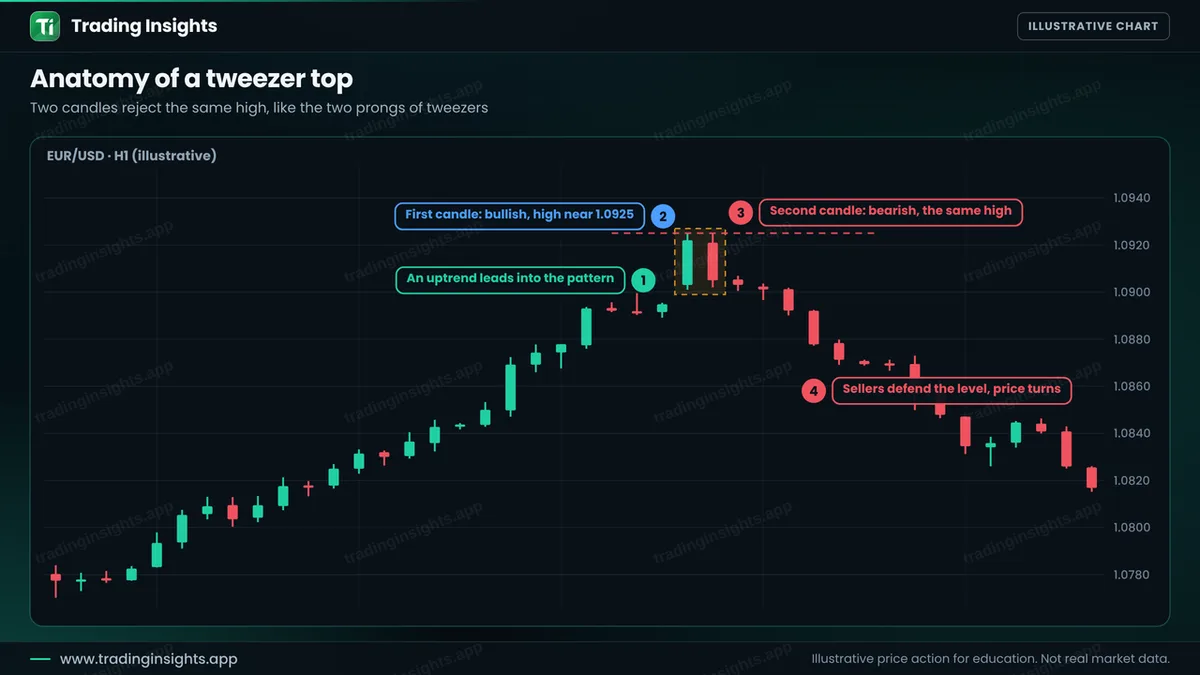
The candles do not need to be perfect. A difference of a pip or two is normal. What matters is that the highs, or the lows, are almost the same, and that the pattern appears at the end of a clear move or at a strong level. See support and resistance.
Top, bottom and a false one
The third chart shows a false tweezer. The second candle goes clearly above the first, so there is no rejection, and price keeps rising. Compare this with the pin bar, which shows rejection in a single candle. A tweezer shows it over two candles.
The rules, step by step
- Find the trend. The pattern needs a move to reverse.
- Find two candles with almost equal highs (or lows).
- Check the location. A level, a round number or a previous high makes it stronger.
- Wait for the second candle to close. For a top, it should be bearish.
- Enter after the close. Some traders wait for one more candle for extra confirmation.
- Place the stop. Above the shared high with a small buffer.
- Set the target. Twice the risk, or the next support level.
A worked trade
This is an illustrative sell on EUR/USD, H1. After a steady rise, two candles reach 1.0925. The second one is bearish and closes at 1.0905. You sell there, place the stop above the shared high at 1.0927, and target twice the risk at 1.0861.
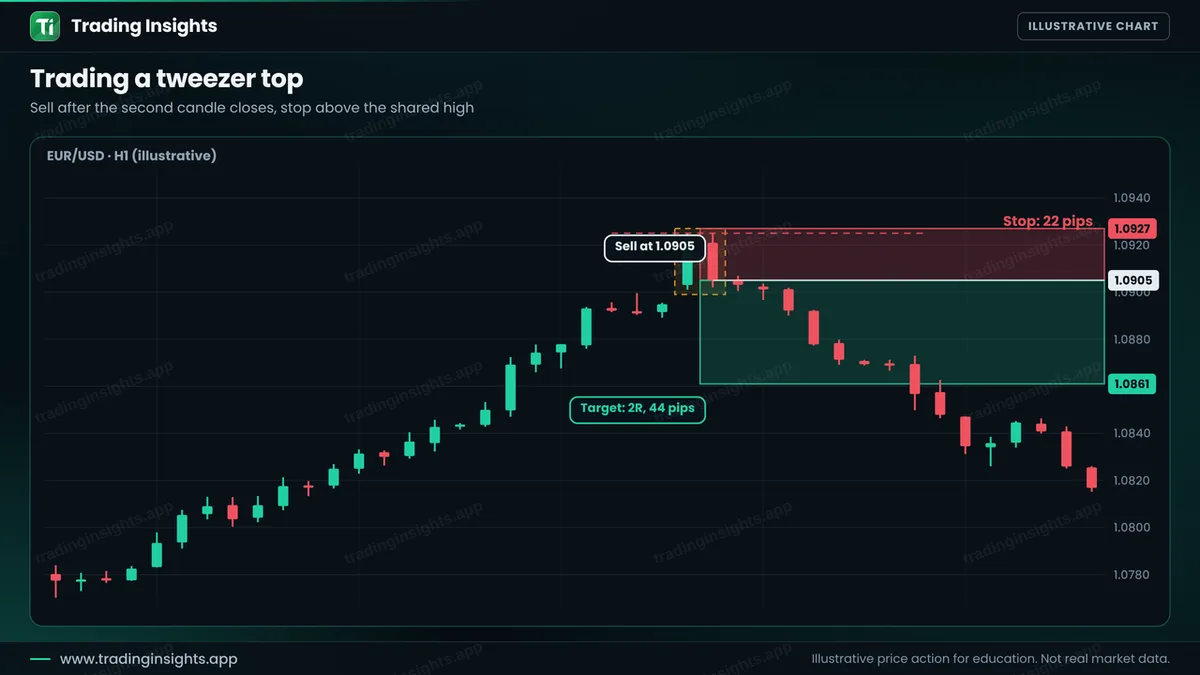
- Entry: 1.0905, after the bearish candle closes.
- Stop loss: 1.0927, above the shared high (22 pips).
- Take profit: 1.0861 (44 pips), a ratio of 1:2.
With a $10,000 account risking 1% ($100), the position size is $100 / (22 pips x $10 per pip per lot) = about 0.45 lot. A win pays about $200, and a loss costs about $100. Check your own numbers with the position size calculator. The stop is small because the pattern gives a precise level, which is one of the nice parts of the tweezer. A small stop also means that normal noise can reach it, so use a small buffer.
How to avoid the common failures
- Do not trade it in the middle of nowhere. Equal highs in a strong uptrend can be a pause before a continuation.
- Wait for the close. A second candle that is still open may break the high.
- Add confluence. A level plus a pattern is better than a pattern alone. See confluence trading.
- Look at the timeframe. A tweezer on H4 or daily is usually more important than one on M5.
- Test it. See how to backtest.
Common mistakes
- Calling two candles a tweezer when the highs differ by a lot.
- Trading it against a strong trend with no level nearby.
- Entering before the second candle closes.
- Placing the stop exactly at the shared high.
- Forgetting the spread when the stop is small.
Frequently asked questions
What is a tweezer top?
It is a two-candle pattern at the end of an uptrend in which both candles have nearly the same high, which shows that the price was rejected twice.
Do the two candles need to be different colours?
Usually the first is the colour of the trend and the second is the opposite, which makes the rejection clearer. The shared high or low matters most.
Is a tweezer bottom the same as a double bottom?
It is similar in idea, but a tweezer bottom is two adjacent candles, while a double bottom is two separate lows with a rise between them.
How reliable is the pattern?
No pattern is reliable on its own. The location, the trend and the confirmation matter, and you should test it before using real money.
Trading involves risk. This is education, not financial advice. The charts are illustrative and not real market data. Trading carries risk, and no method guarantees results.


