
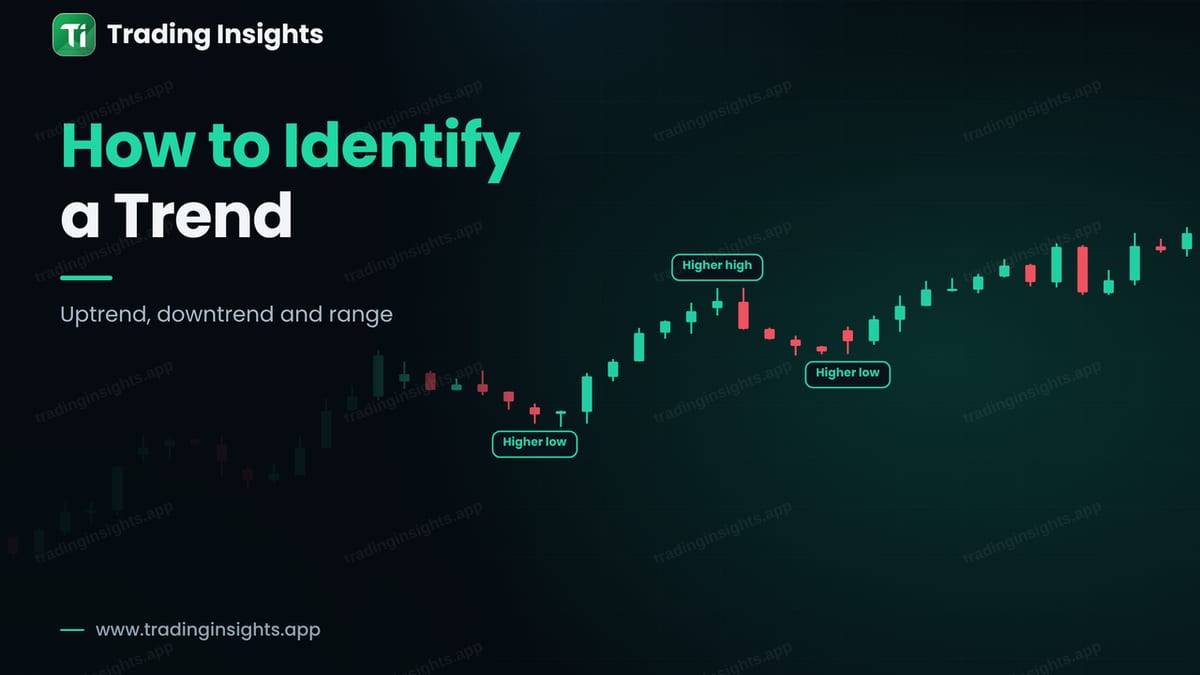
The first question before any trade is simple: what is the market doing? Price can rise, fall or move sideways. Traders call these an uptrend, a downtrend and a range. If you read this wrongly, even a good entry can fail, because you trade against the flow. The good news is that you can identify the trend without any indicator, using only highs and lows.
The uptrend: higher highs and higher lows
In an uptrend, price makes a series of higher highs and higher lows. Each push up goes above the last high, and each pullback stops above the last low. This shows that buyers are in control. As long as the higher lows hold, the uptrend is intact.
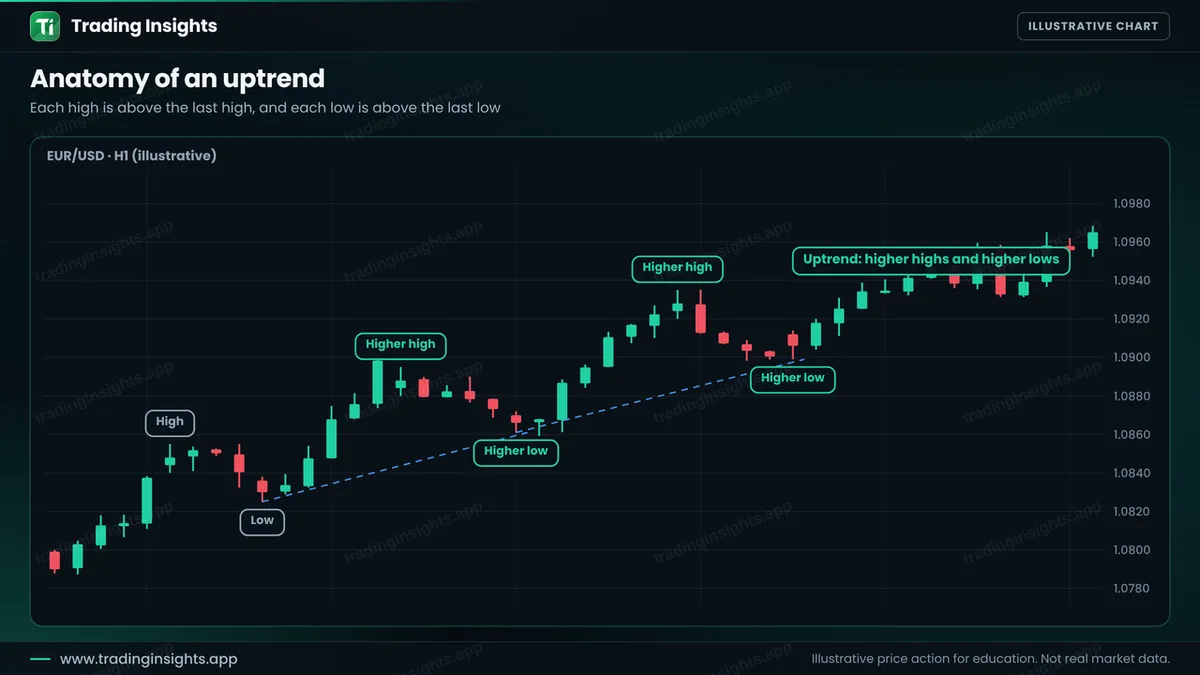
The swing points are the key. A swing high is a peak with lower highs on both sides, and a swing low is a trough with higher lows on both sides. For a full guide, see swing highs and lows.
Three market states
- Uptrend. Higher highs and higher lows. Look to buy pullbacks.
- Downtrend. Lower highs and lower lows. Look to sell rallies.
- Range. Price moves between a ceiling and a floor, with no clear progress. See range trading.
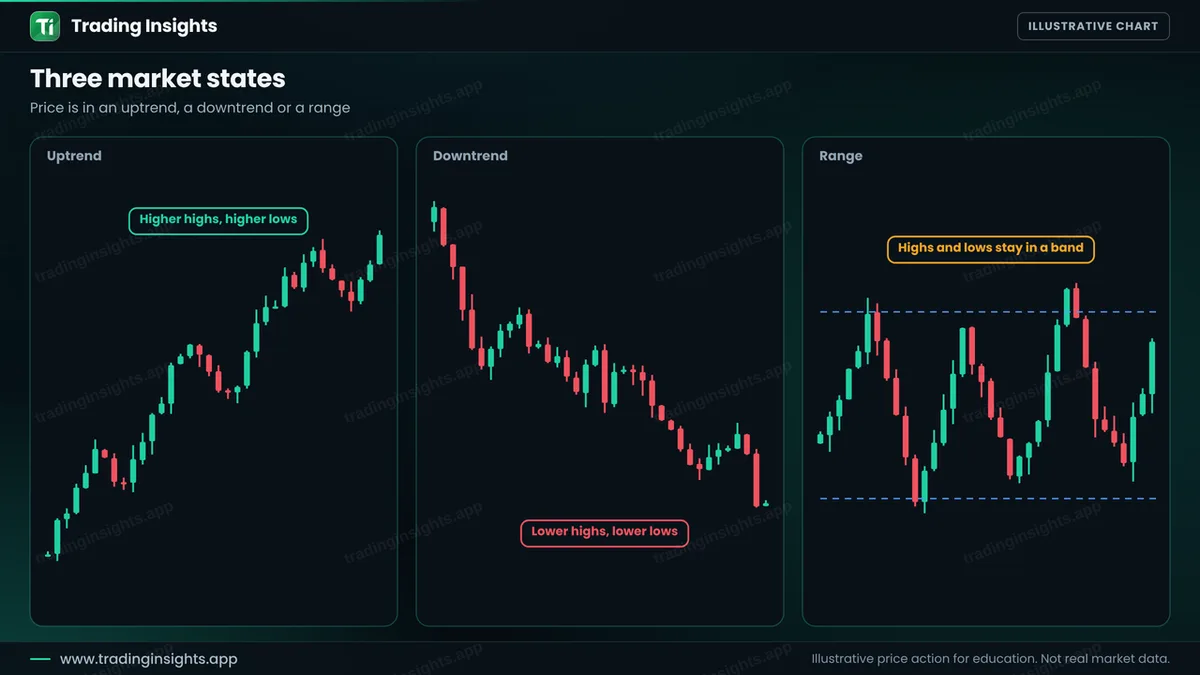
The market spends a lot of time in ranges, so do not force a trend where there is none. If you cannot see it in a few seconds, the trend is probably not clear.
How to identify the trend, step by step
- Start on a higher timeframe. The H4 or daily chart shows the main direction. See top-down analysis.
- Mark the swing highs and lows. Only the clear ones.
- Compare each one with the last. Higher highs and higher lows mean an uptrend. Lower highs and lower lows mean a downtrend.
- Watch for a break. In an uptrend, a close below the last higher low is a warning. See break of structure.
- Add a tool if you like. A moving average can help. See moving averages and trend lines.
A worked trade with the trend
This is an illustrative buy on EUR/USD, H1. Price is in an uptrend with clear higher highs and higher lows. After the last pullback forms a higher low at 1.0899, a bullish candle closes at 1.0918. You buy there, place the stop below the higher low at 1.0896, and target twice the risk, which is 1.0962.
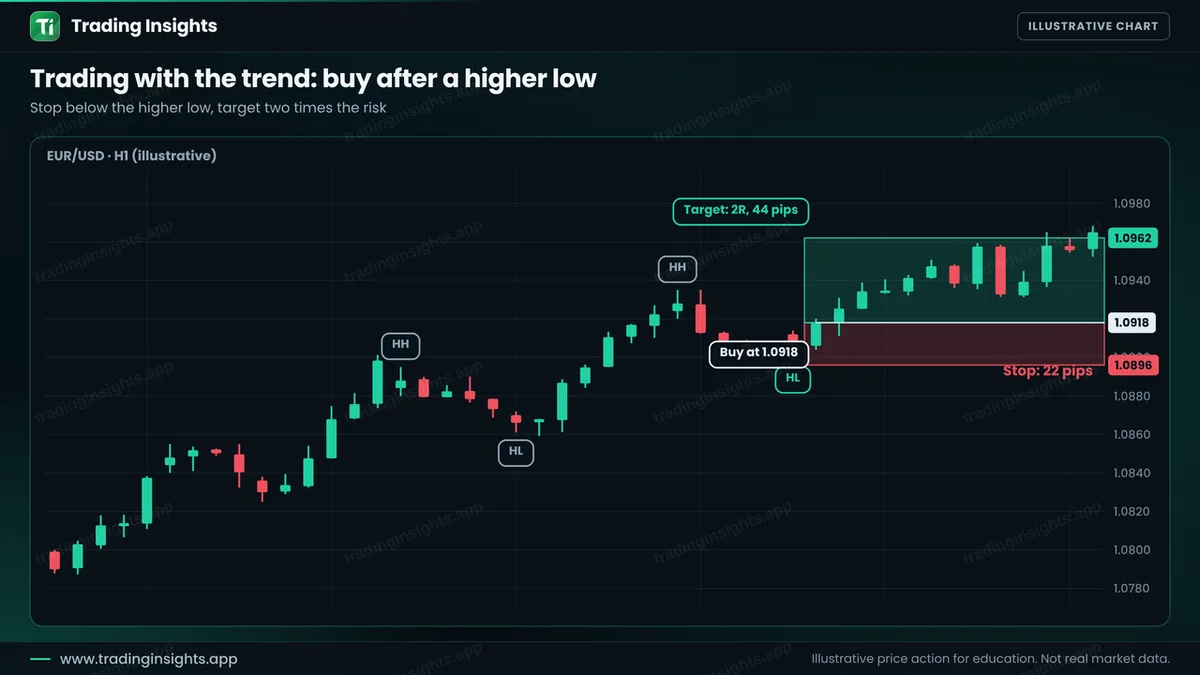
- Entry: 1.0918, after a bullish candle closes above the higher low.
- Stop loss: 1.0896, below the higher low (22 pips).
- Take profit: 1.0962 (44 pips), a ratio of 1:2.
With a $10,000 account risking 1% ($100), the position size is $100 / (22 pips x $10 per pip per lot) = about 0.45 lot. A win pays about $200, and a loss costs about $100. Check your own numbers with the position size calculator. To tell a pause from a turn, see pullback vs reversal.
Common mistakes
- Calling a trend after two candles.
- Marking every tiny wiggle as a swing point.
- Trading against the higher-timeframe trend.
- Using a trend tool in a range.
- Staying in a trend trade after the last higher low breaks.
Frequently asked questions
How do I know if the market is trending?
Look at the swing points. Higher highs and higher lows mean an uptrend, and lower highs and lower lows mean a downtrend. If neither, it may be a range.
What is the easiest way to spot a trend?
Zoom out to a higher timeframe and mark the clear swing highs and lows. The direction of the sequence shows the trend.
Can a trend change quickly?
It can. A close beyond the last swing point, with strong candles, is an early warning. But some breaks fail, so wait for confirmation.
Should I always trade with the trend?
It is often easier, because the market has momentum. But range trading and reversal strategies exist, and they have their own rules.
Trading involves risk. This is education, not financial advice. The charts are illustrative and not real market data. Trading carries risk, and no method guarantees results.


