
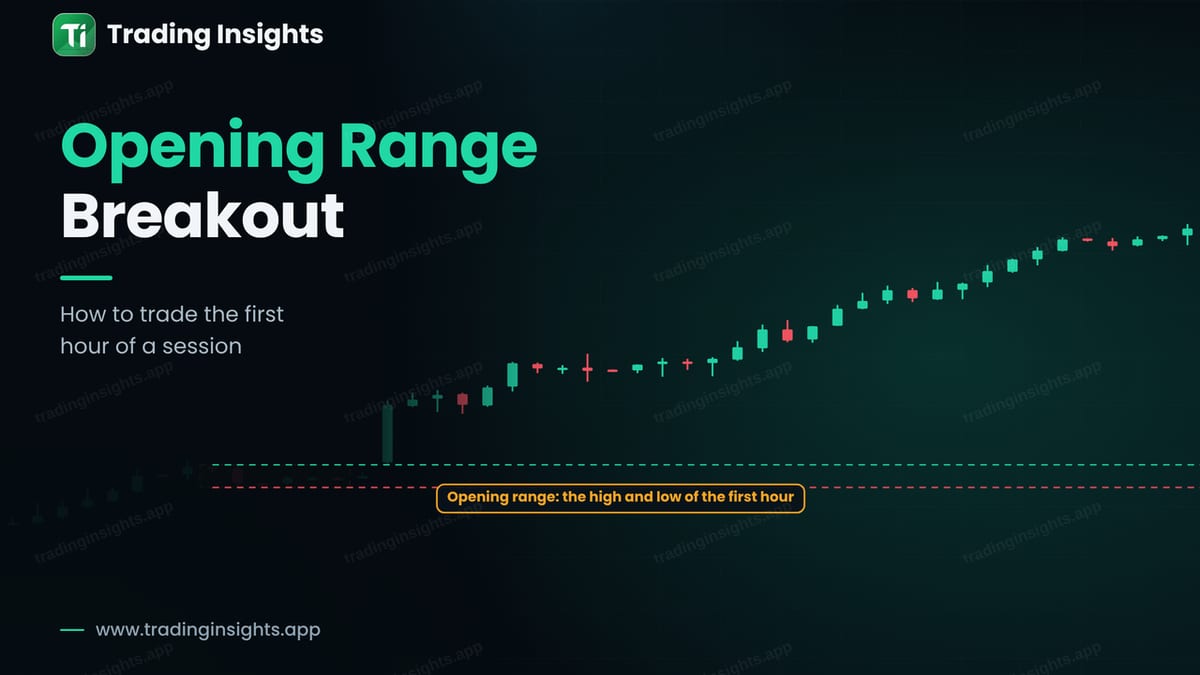
When a trading session opens, price often moves in a small area for a short time, and then makes a bigger move. The opening range breakout (ORB) strategy uses that small area as a map. You mark the high and the low of the first part of the session, and you trade the break of either side. It is simple, it has clear levels, and it is easy to test.
What is the opening range?
The opening range is the high and the low of the first period after a session starts. Many traders use the first 30 minutes or the first hour. In forex you can apply it to the London open or the New York open. Early in a session, traders are still deciding, and price is often balanced. When the balance ends, price leaves the range, and the break can lead to a strong move. To learn more about the sessions, see forex trading sessions. The same idea is used in the London breakout strategy.
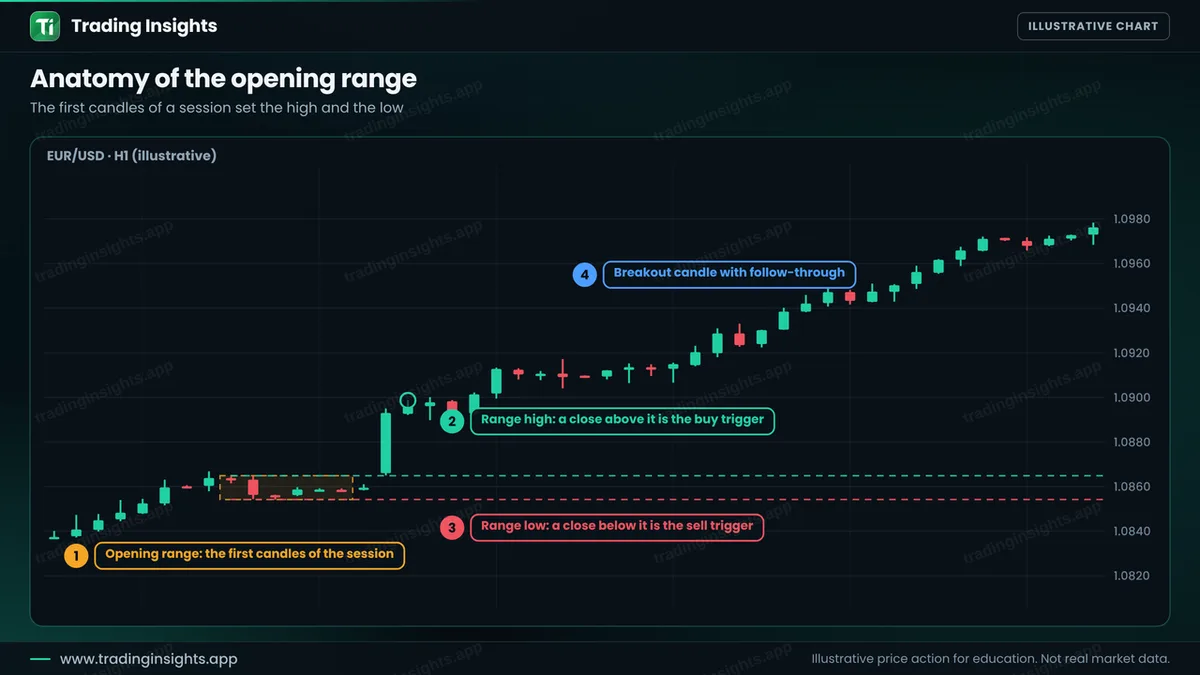
The range gives you two things: a trigger and a stop. The trigger is a close beyond the high or the low. The stop is on the other side of the range, because if price returns inside and goes through the opposite side, the idea has failed.
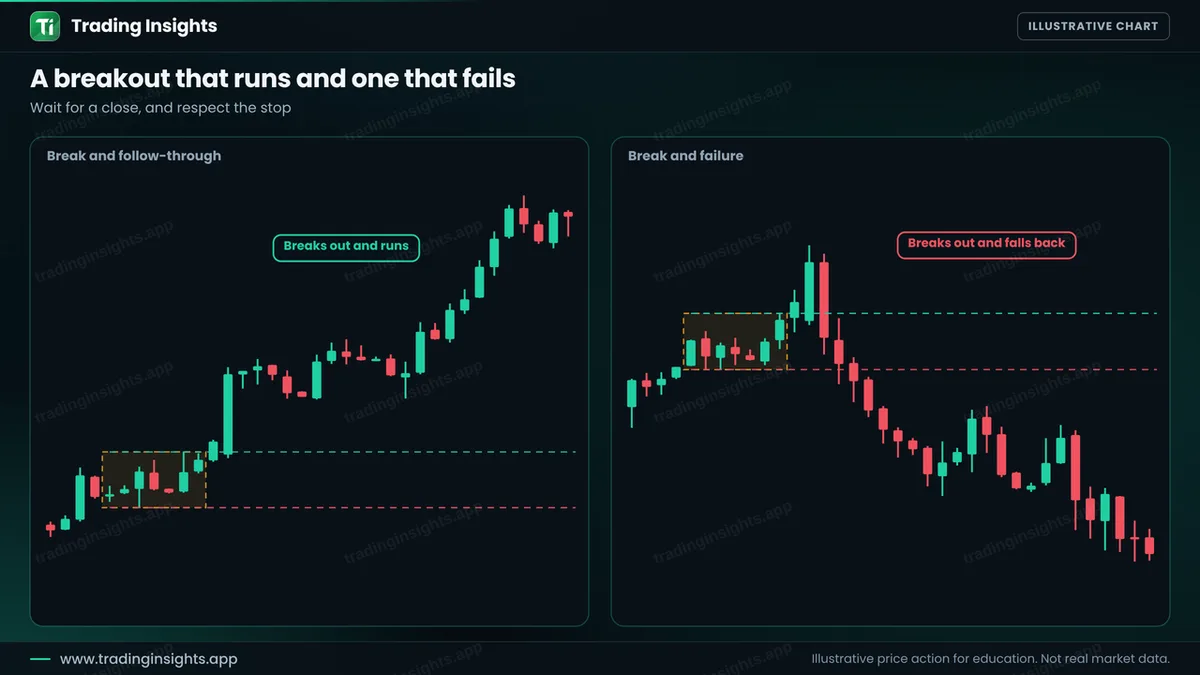
A breakout that runs and one that fails
Not every breakout works. Sometimes price closes above the high, then falls back inside and breaks the low. This is a fake break, and it is the main risk of the strategy. A stop loss keeps the loss small. To learn more about this problem, see false breakouts.
The rules, step by step
- Choose the session and the period. For example, the first hour of the London session. Keep the same choice for all your tests.
- Mark the high and the low. Draw two horizontal lines when the period ends.
- Check the size of the range. A very wide range makes the stop too big. A very small range can be noise.
- Wait for a close outside. A candle must close above the high for a buy, or below the low for a sell.
- Enter after the close. Do not enter in the middle of the candle.
- Place the stop. Just beyond the other side of the range.
- Set the target. Twice the risk, or the next support or resistance level.
A worked trade
This is an illustrative buy on EUR/USD, H1. The range of the first candles has its low near 1.0854. A strong candle closes above the high at 1.0893. You buy there, place the stop below the range low at 1.0852, and target twice the risk at 1.0975.
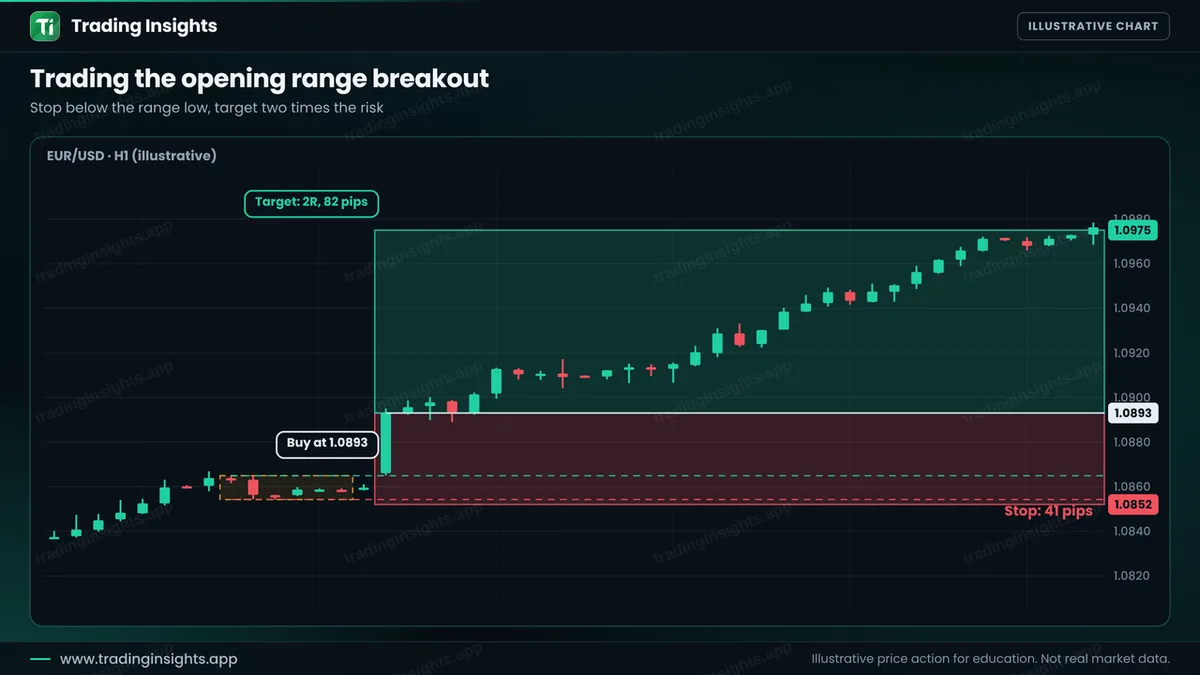
- Entry: 1.0893, after the close above the range high.
- Stop loss: 1.0852, below the range low (41 pips).
- Take profit: 1.0975 (82 pips), a ratio of 1:2.
With a $10,000 account risking 1% ($100), the position size is $100 / (41 pips x $10 per pip per lot) = about 0.24 lot. A win pays about $200, and a loss costs about $100. Check your own numbers with the position size calculator. If the stop is too wide for you, some traders use the middle of the range as the stop. That makes the stop smaller, but it is hit more often.
How to avoid the common failures
- Skip very wide ranges. A range that is already large leaves little room for the move.
- Avoid news. A news release can break the range and reverse in seconds. See trading forex news.
- Use the trend. A breakout in the direction of the higher-timeframe trend is usually better. See top-down analysis.
- Take one trade per session. After a failed break, do not chase both sides.
- Test it. Test at least 50 sessions before using real money. See how to backtest.
Common mistakes
- Changing the range period after seeing the chart.
- Entering on a wick instead of a close.
- Using a stop so wide that the ratio becomes poor.
- Trading on a very quiet day with a tiny range.
- Taking the opposite trade right after a stop, out of anger.
Frequently asked questions
What is an opening range breakout?
It is a strategy that trades the break of the high or low formed during the first period of a session.
How long should the opening range be?
Many traders use 30 or 60 minutes. The best choice is the one you test and use in the same way each time.
Does the strategy work in forex?
Forex has sessions with clear opens, such as London and New York, so the idea can be applied. Results depend on the pair, the day and your rules, so test it.
Where should I place the stop?
A common place is just beyond the opposite side of the range. A tighter stop at the middle of the range is also used but is hit more often.
Trading involves risk. This is education, not financial advice. The charts are illustrative and not real market data. Trading carries risk, and no method guarantees results.


