
Every trading day leaves behind two simple numbers: the high and the low. The next day, many traders look at these numbers again. The previous day high (PDH) and previous day low (PDL) are easy to draw, they do not need any indicator, and price often reacts near them. This article explains how to use them in a clear, testable plan.
Why these levels matter
A day high is a place where buyers ran out for that day. A day low is a place where sellers ran out. Many traders place their stops and entries near these points, so the levels attract orders. When price returns to them, it can reject, or it can break and run. Your job is to tell the two cases apart, using a close and the reaction after it.
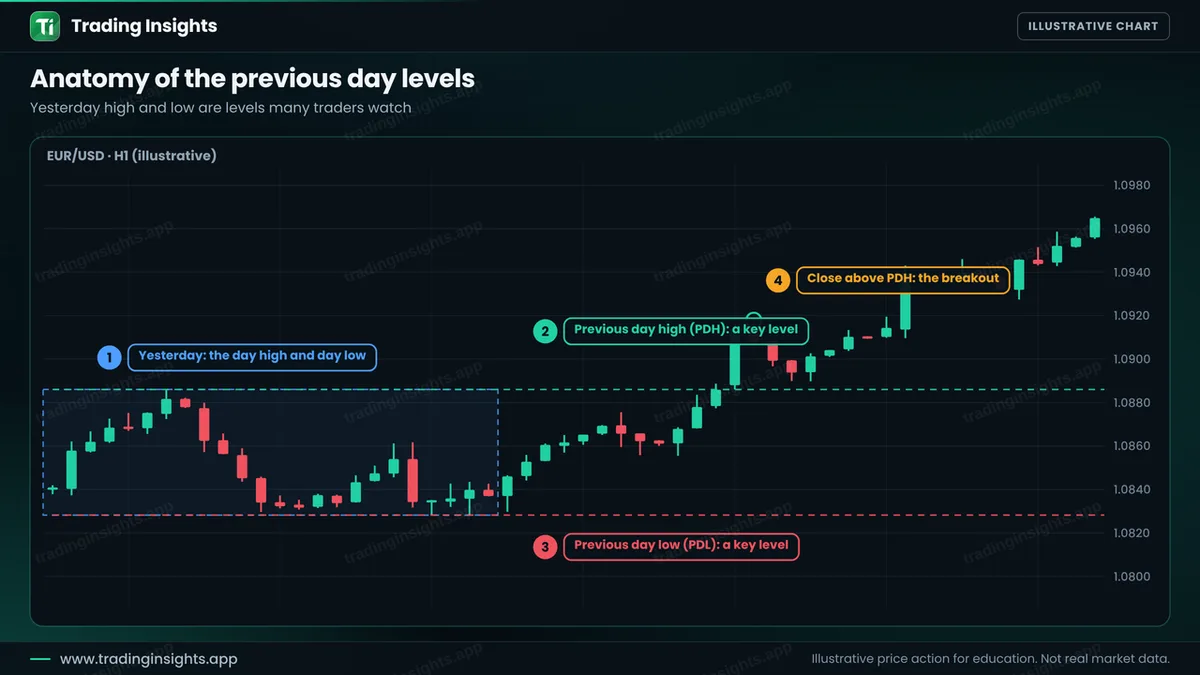
On an hourly chart, mark the high and the low of the full previous day and extend the lines to the right. It takes a minute. If you have already drawn key levels, these two lines often agree with them. See support and resistance.
A real break and a sweep
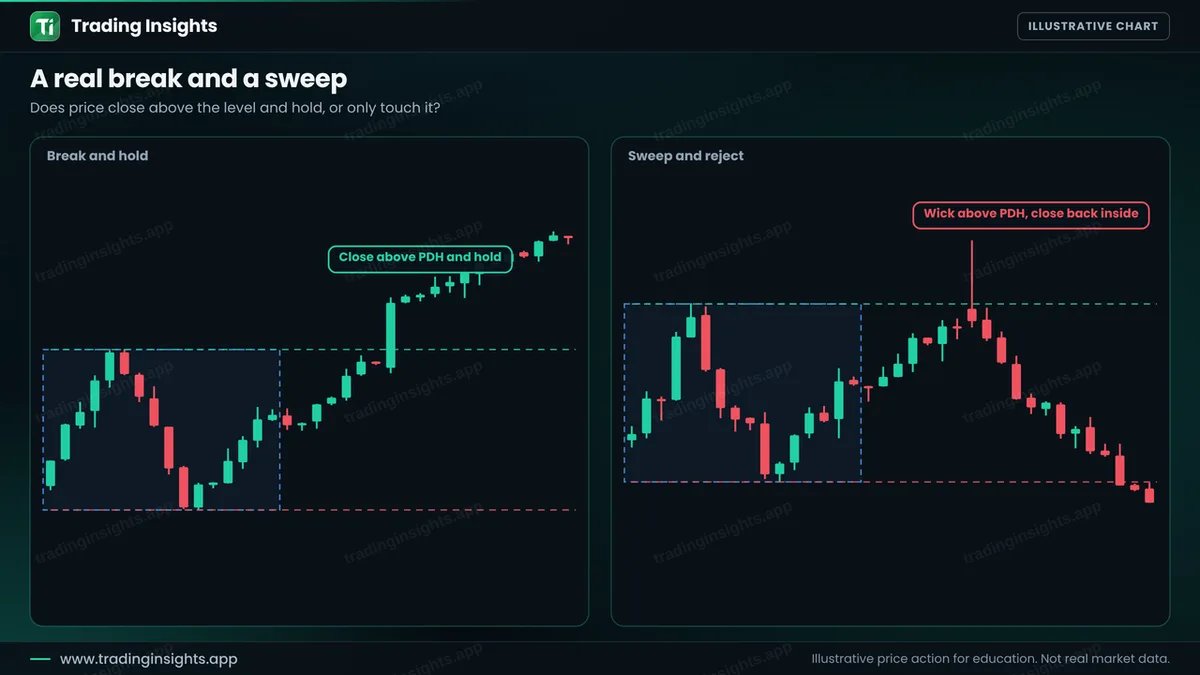
In a real break, a candle closes above the level and price stays above it. In a sweep, price pokes above the level, takes the stops there, and closes back inside. The sweep can be a good sell signal, but only after the close back below. To learn more, see liquidity sweeps.
The rules for the breakout trade
- Mark PDH and PDL from the full previous day.
- Wait for a close beyond a level. A wick does not count.
- Check the context. A break in the direction of the daily trend is better than one against it.
- Enter after the close or on a retest of the level.
- Place the stop just inside the old range, below the broken level with a small buffer.
- Set the target at twice the risk, or at the next level.
A worked trade
This is an illustrative buy on EUR/USD, H1. Yesterday high is near 1.0886. Today a strong candle closes above it at 1.0914. You buy there, place the stop below the level at 1.0883, and target twice the risk at 1.0976.
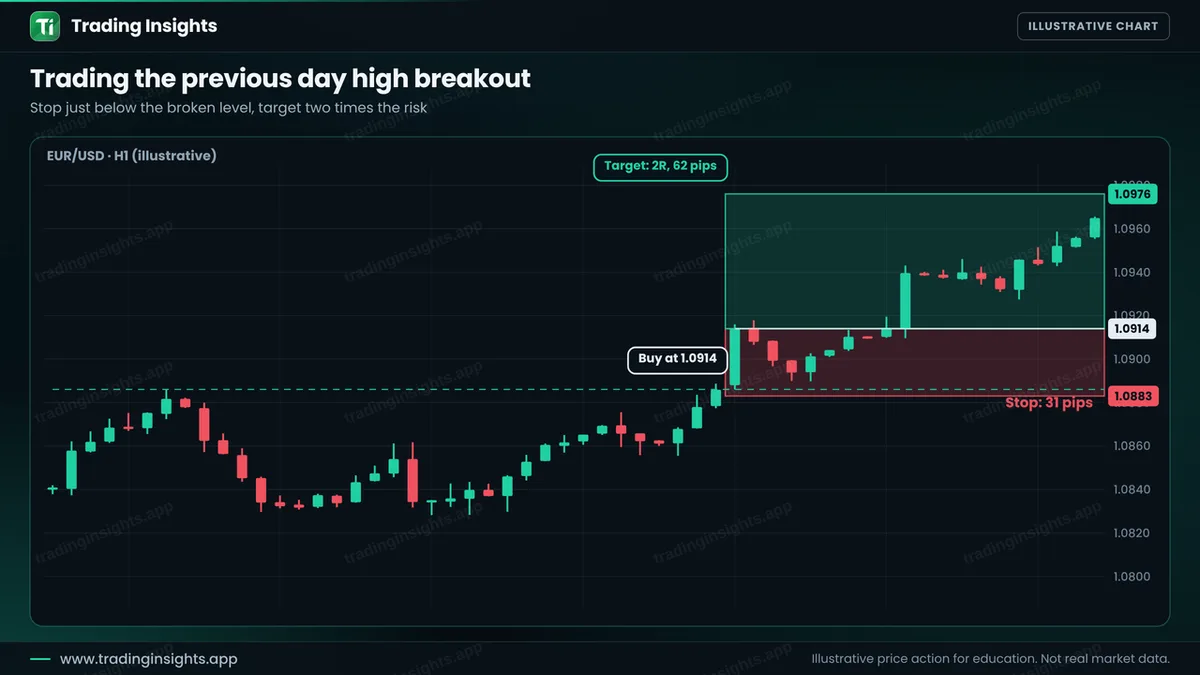
- Entry: 1.0914, after the close above PDH.
- Stop loss: 1.0883, below the broken level (31 pips).
- Take profit: 1.0976 (62 pips), a ratio of 1:2.
With a $10,000 account risking 1% ($100), the position size is $100 / (31 pips x $10 per pip per lot) = about 0.32 lot. A win pays about $200, and a loss costs about $100. Check your own numbers with the position size calculator. If price pulls back to the level and holds, a retest entry can give a smaller stop. See break and retest.
How to avoid the common failures
- Do not trade every touch. A touch is not a signal. Wait for a close.
- Watch the time. A break during the quiet hours of the Asian session is weaker than one at the London open.
- Beware of news. Spikes can sweep a level and reverse. See trading forex news.
- Check the room. If another strong level is right above, the target is close and the ratio is poor.
- Test it. See how to backtest.
Common mistakes
- Using the high of the last few hours instead of the full previous day.
- Selling every touch of the high without a sign of rejection.
- Putting the stop exactly at the level, where noise can reach it.
- Ignoring the daily trend.
- Forgetting that the levels reset every day.
Frequently asked questions
What is the previous day high?
It is the highest price reached during the previous trading day. The previous day low is the lowest price of that day.
Which timezone should I use for the day?
Use the same day definition every time. Many traders use the close of the New York session, but the key is to be consistent in your tests.
Is a break of the previous day high always bullish?
No. If price closes back inside, it can be a sweep, which sometimes leads to a drop. Wait for the close and the reaction.
Can I use this on other timeframes?
Yes. The same idea works with the previous week high and low on a higher timeframe, but the stops will be larger.
Trading involves risk. This is education, not financial advice. The charts are illustrative and not real market data. Trading carries risk, and no method guarantees results.


