
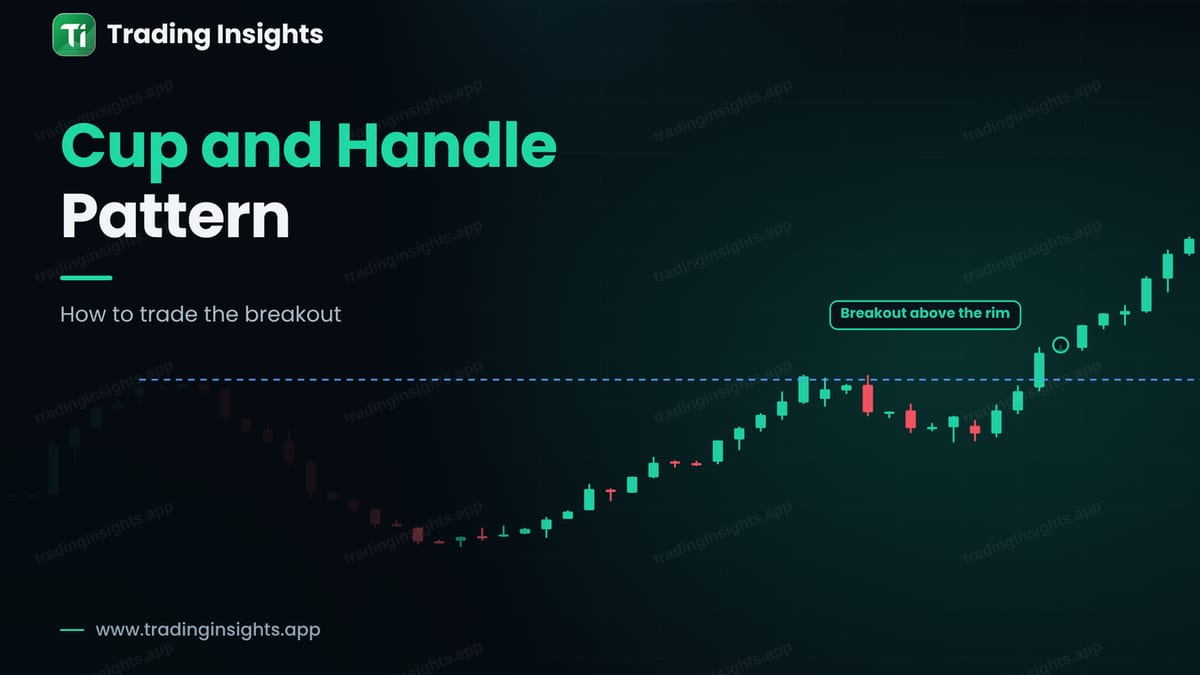
The cup and handle is a bullish pattern that looks like a teacup seen from the side. Price falls from a high, curves along a rounded bottom, and climbs back to the same level. Then it pauses in a small dip, which is the handle, and finally breaks out above the high. Traders use it as a continuation pattern, because it often appears inside an uptrend.
What the pattern looks like
There are five parts. The left rim is the high before the decline. The cup is a rounded, U-shaped recovery. The right rim is the return to the same level. The handle is a small, shallow pullback just below the rim. The breakout is a close above the rim. The logic is that sellers tried to push the price down, failed to keep it there, and then lost control again at the rim.
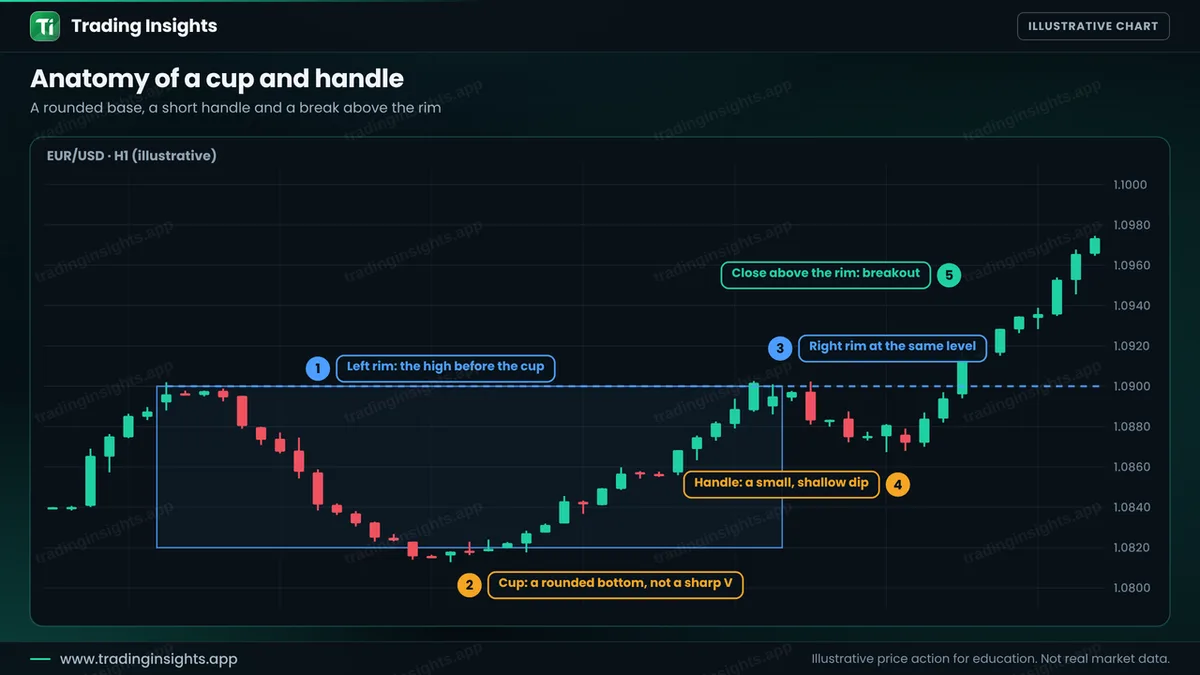
The handle matters. It shows a small pause of profit-taking before the move. If the handle is deep, close to the cup bottom, the buyers are weak and the pattern is less reliable. A good handle retraces only a small part of the cup depth.
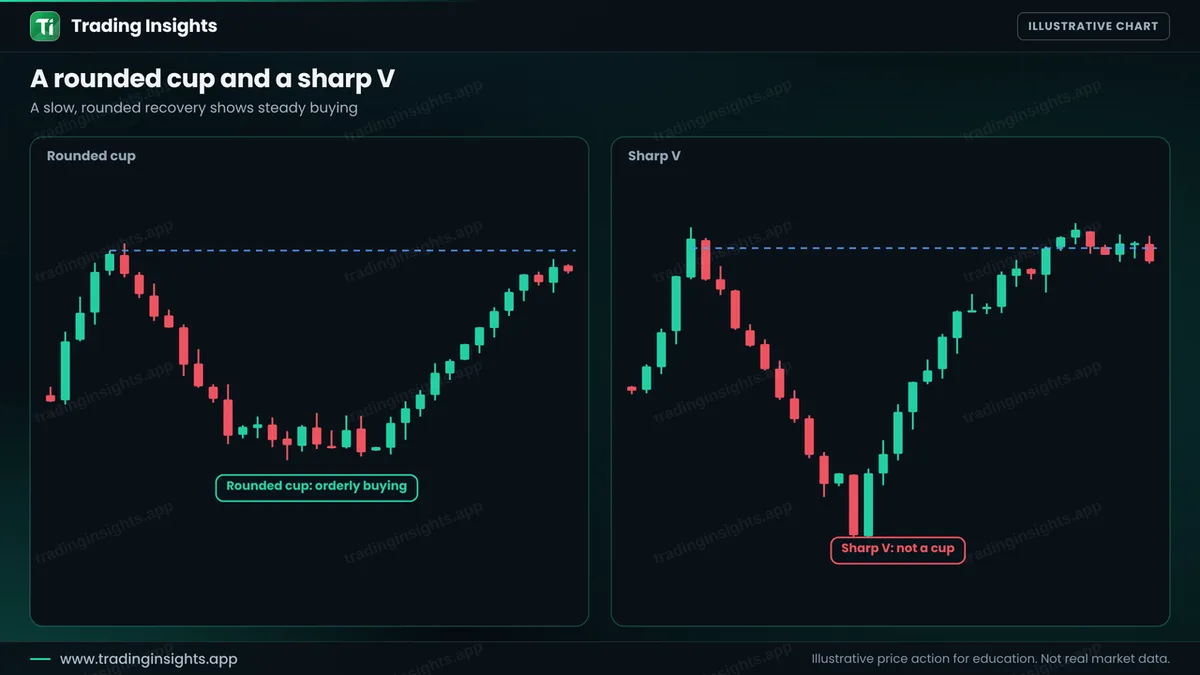
A rounded cup and a sharp V
The shape is the key. A rounded cup means that selling slowed down, buyers gradually took over and price returned in an orderly way. A sharp V is different. It is a fast fall and a fast rise with no base in between. That is not a cup, and the pattern has no time to build a base. If you cannot draw a smooth curve through the lows, skip it.
The rules, step by step
- Find an uptrend or a strong prior move. The pattern works best as a continuation.
- Mark the rim. Draw a horizontal line at the left rim high.
- Check the cup. A rounded base that returns close to the rim level.
- Check the handle. A short, shallow dip, smaller than the cup depth.
- Wait for the breakout. A candle must close above the rim. A wick is not enough.
- Place the stop. Below the low of the handle, with a small buffer.
- Set the target. Add the depth of the cup to the rim. That is the measured move.
A worked trade
This is an illustrative buy on EUR/USD, H1. The rim is near 1.0900 and the cup bottom is near 1.0820, so the cup is about 80 pips deep. After a small handle, a candle closes above the rim at 1.0914. You buy there, place the stop below the handle low at 1.0865, and target the measured move at 1.0980.
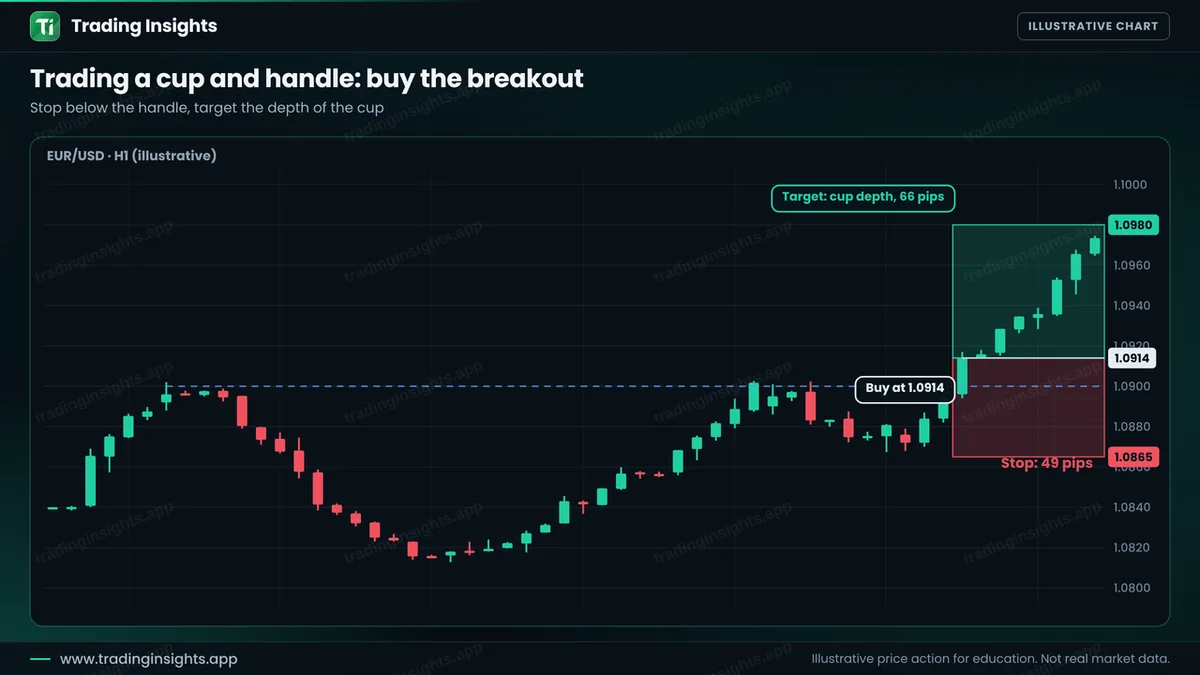
- Entry: 1.0914, after the close above the rim.
- Stop loss: 1.0865, below the handle low (49 pips).
- Take profit: 1.0980 (66 pips), a ratio of about 1:1.35.
With a $10,000 account risking 1% ($100), the position size is $100 / (49 pips x $10 per pip per lot) = about 0.20 lot. A win pays about $135, and a loss costs about $100. Check your own numbers with the risk reward calculator. A ratio of 1:1.35 is modest. Some traders take a part of the profit at the target and trail the rest. A tighter stop, just below the rim, improves the ratio but is easier to hit. See trailing stop and break-even stop.
How to avoid the common failures
- Do not force the pattern. A cup must be visible without effort.
- Beware of a fake break. Price can close above the rim and fall back. See false breakouts.
- Check the trend. A cup inside a higher-timeframe uptrend has more support. See how to identify a trend.
- Test it. Mark 50 or more cups on past charts and record the results. See how to backtest.
Common mistakes
- Calling a sharp V a cup.
- Entering inside the handle before a breakout.
- Using a handle that is as deep as the cup.
- Putting the stop inside the handle.
- Expecting the full measured move every time.
Frequently asked questions
What is a cup and handle pattern?
It is a bullish pattern with a rounded cup, a small pullback called the handle, and a breakout above the rim.
How long does a cup and handle take to form?
It can take from a few dozen candles to many. The key is the rounded shape, not the exact number of candles.
How do I set the target?
A common method is to add the depth of the cup to the rim level. Some traders take profit earlier and trail the rest.
Is there a bearish version?
Yes. An inverted cup and handle is a rounded top followed by a small bounce and a break below the base. The rules are reversed.
Trading involves risk. This is education, not financial advice. The charts are illustrative and not real market data. Trading carries risk, and no method guarantees results.


