
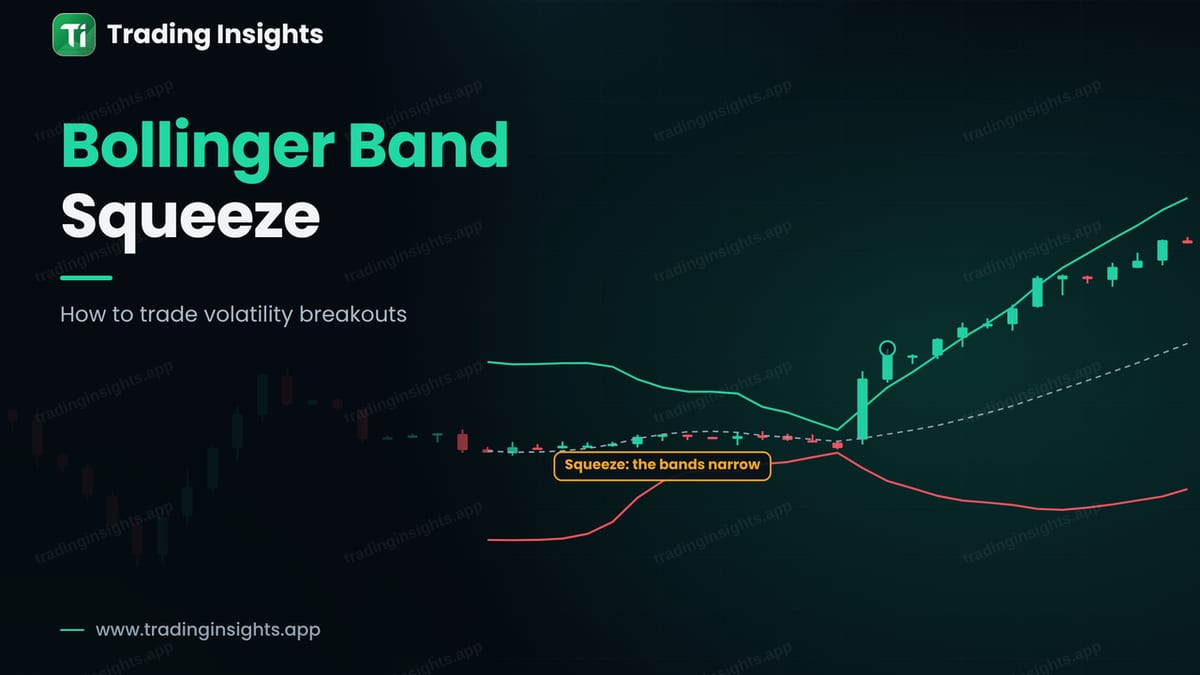
Markets move in cycles of quiet and fast periods. After a quiet period, volatility often returns. The Bollinger band squeeze is a strategy that tries to catch the start of a fast move after a quiet phase. It uses the width of the Bollinger bands as a measure of volatility: when the bands are tight, the market is quiet, and a breakout may be near.
A quick reminder: Bollinger bands
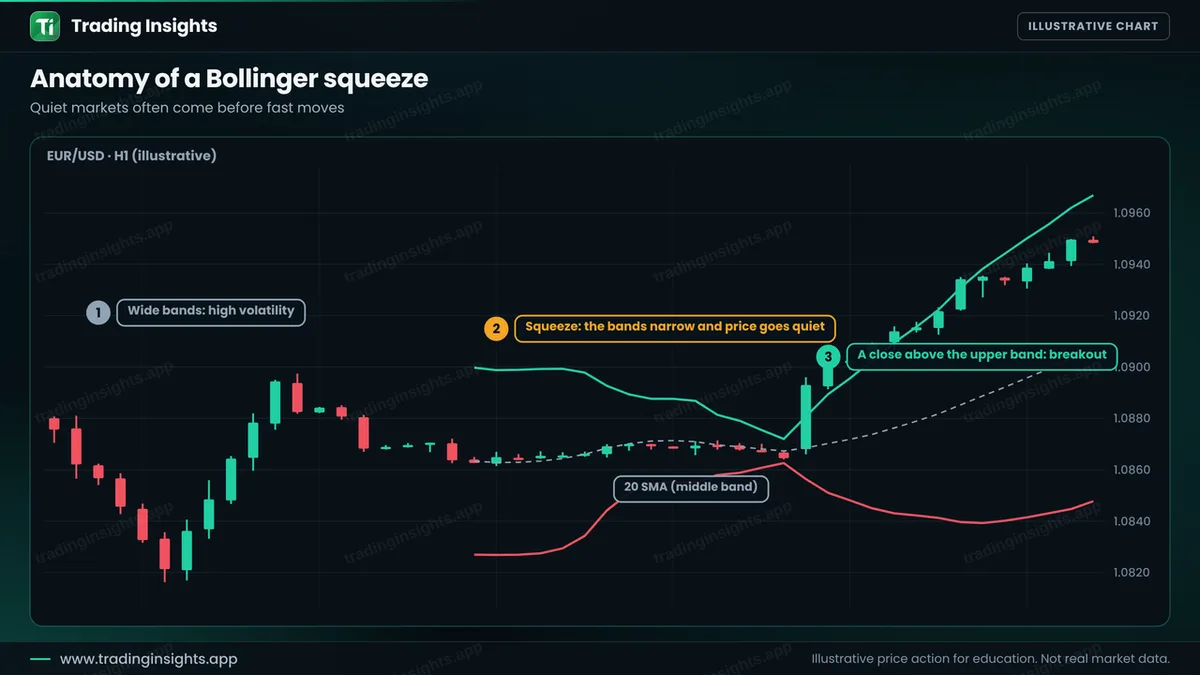
Bollinger bands have three lines. The middle line is a 20-period simple moving average. The upper and lower bands are placed two standard deviations above and below the middle line. When price moves a lot, the bands widen. When price is calm, the bands narrow.
What a squeeze looks like
First the bands are wide, because price was moving a lot. Then price calms down, the candles become small and the bands come closer together. This is the squeeze. Finally, a candle closes outside one band, and the bands start to open again. The squeeze does not tell you the direction. It only tells you that energy has built up, and the breakout shows the side.
A squeeze that runs and one that fails
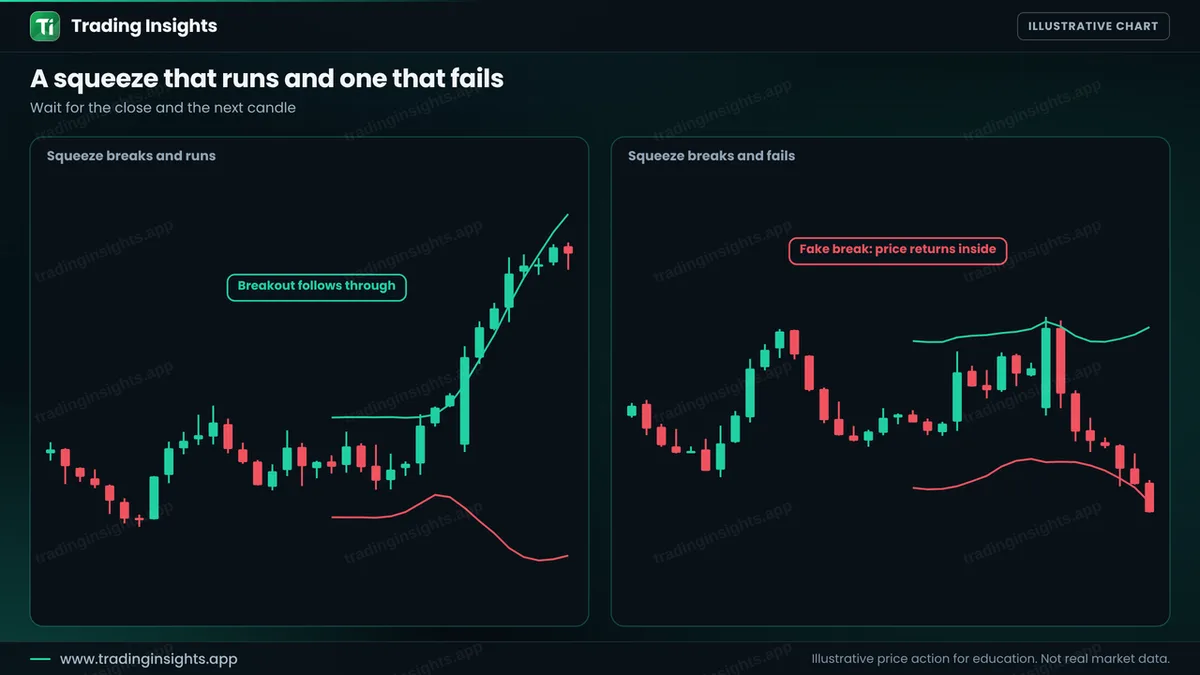
Not every squeeze ends well. Sometimes price closes outside the band and then falls back inside, which is a fake break. A close outside the band is a trigger, not a promise. That is why you need a stop and a clear plan. See false breakouts.
The rules, step by step
- Find the squeeze. The bands are clearly narrower than they were in recent history, and the candles are small.
- Wait for a close outside a band. A close above the upper band is a buy trigger. A close below the lower band is a sell trigger.
- Prefer a strong candle. A large-bodied candle shows that volatility has returned.
- Enter after the close. Do not enter in the middle of the candle.
- Place the stop. At the middle band, or just below it with a small buffer. If price returns to the middle of the squeeze, the idea has failed.
- Set the target. Twice the risk is common. Some traders trail the stop along the middle band.
A worked trade
This is an illustrative buy on EUR/USD, H1. After a wide-ranging period, price goes quiet and the bands narrow. A strong candle closes above the upper band at 1.0893. You buy there, place the stop at the middle band at 1.0867, and target twice the risk, which is 1.0945.
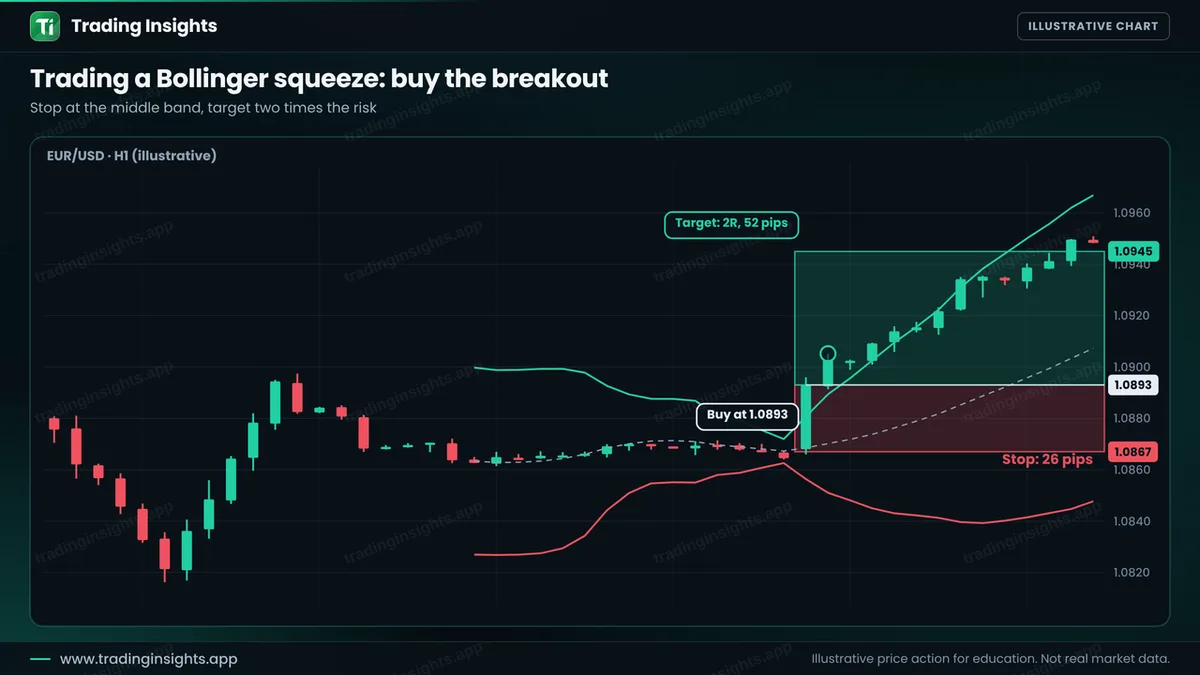
- Entry: 1.0893, after the close above the upper band.
- Stop loss: 1.0867, at the middle band (26 pips).
- Take profit: 1.0945 (52 pips), a ratio of 1:2.
With a $10,000 account risking 1% ($100), the position size is $100 / (26 pips x $10 per pip per lot) = about 0.38 lot. A win pays about $200, and a loss costs about $100. Check your own numbers with the position size calculator.
How to avoid the common failures
- Do not guess the direction. Wait for the close outside the band.
- Do not confuse a trend with a breakout. In a strong trend, price can ride the band for a long time. That is a trend, not a squeeze.
- Avoid news. A news spike can cause a close outside the band that reverses. See trading forex news.
- Combine with context. A breakout in the direction of the higher-timeframe trend is usually better. See top-down analysis.
- Test it. Test on at least 50 squeezes. See how to backtest.
Common mistakes
- Calling any narrow band a squeeze without comparing it with the past.
- Trading both directions at once and paying double costs.
- Entering before the candle closes.
- Using a stop beyond the opposite band, which makes the risk too large.
- Ignoring spread on low-volatility pairs.
Frequently asked questions
What is a Bollinger band squeeze?
It is a period when the Bollinger bands are unusually narrow, which shows low volatility. It often comes before a bigger move.
Does the squeeze show the direction?
No. It only shows that volatility is low. A close outside the upper or lower band shows the direction of the breakout.
Which settings should I use?
The default 20-period average and two standard deviations are the most common. Test any change before using it.
Why do squeeze trades fail?
Some breakouts do not have follow-through, and news can create spikes that reverse. A stop at the middle band limits the loss.
Trading involves risk. This is education, not financial advice. The charts are illustrative and not real market data. Trading carries risk, and no method guarantees results.


