
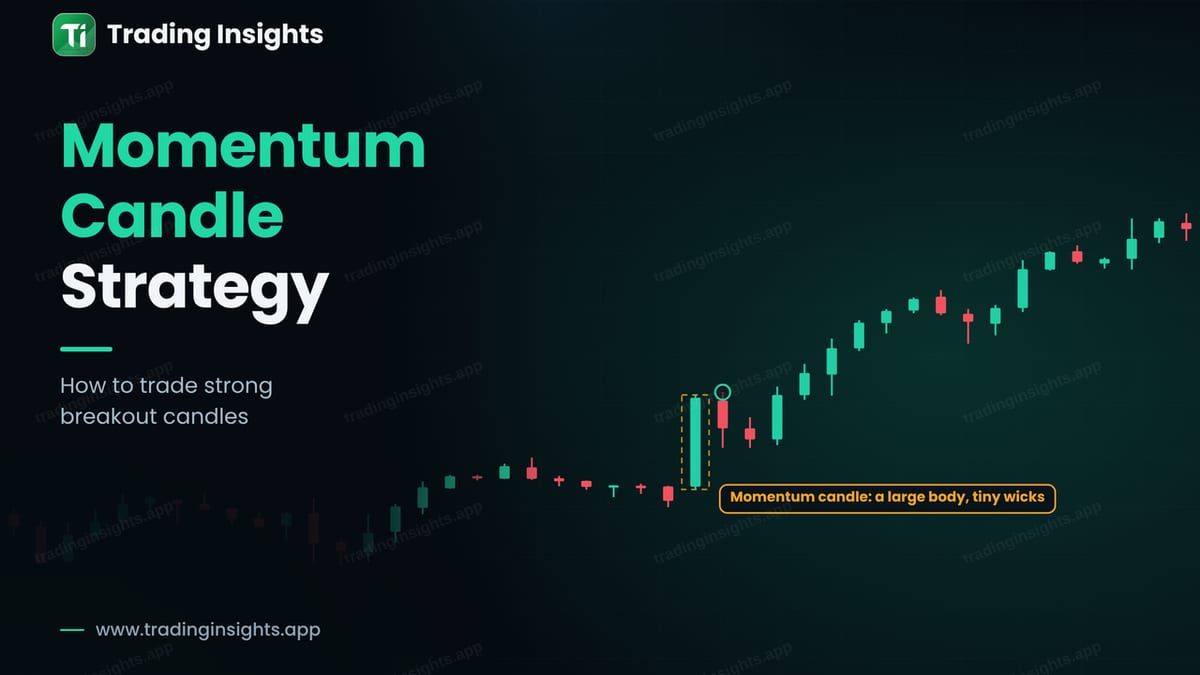
A momentum candle is a candle with a large body and very small wicks. It opens near one end and closes near the other, which shows that one side was in control for the whole period. When it appears after a quiet range, it can mark the start of a new move. The momentum candle strategy trades this idea in a careful way: it does not chase the candle, but waits for a small pullback.
What a momentum candle looks like
A bullish momentum candle opens near its low and closes near its high. Its body is clearly larger than the candles around it, often two to three times the average. Small wicks mean that sellers had little effect. The candle often breaks above a recent high or a range, which is why it is also called a breakout candle.
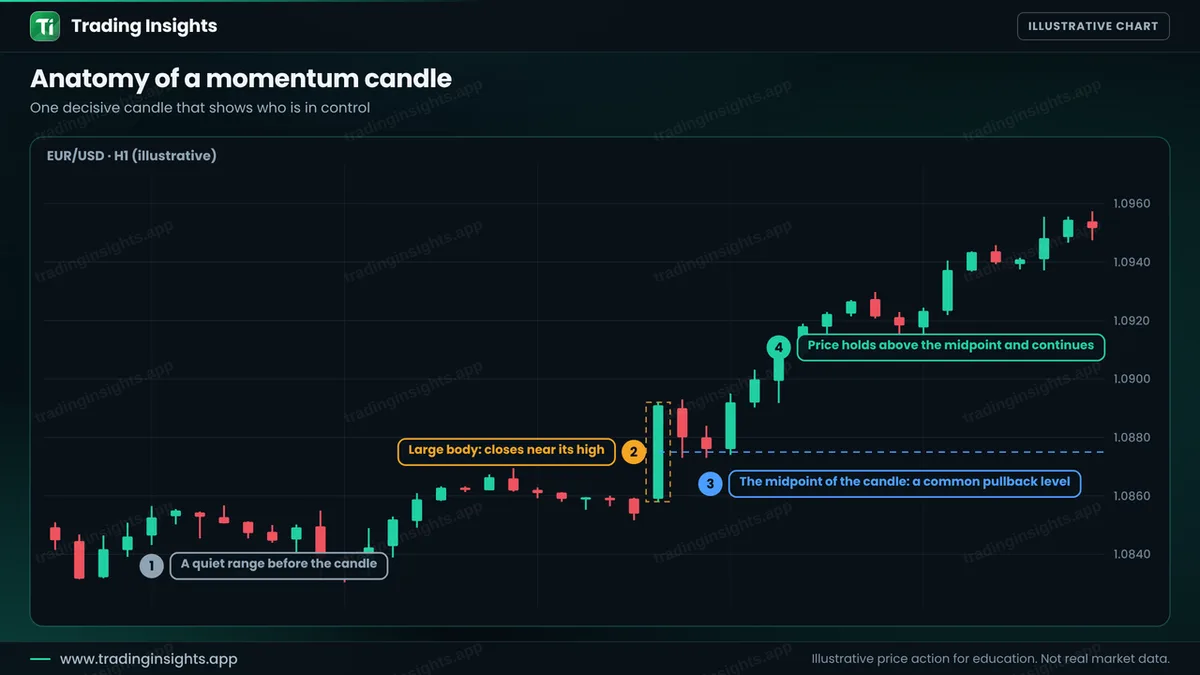
The midpoint of the candle is a useful level. If price pulls back to about half of the candle and holds, buyers are still in control. If price falls back below the candle low, the move has failed.
A fresh candle and an exhausted one
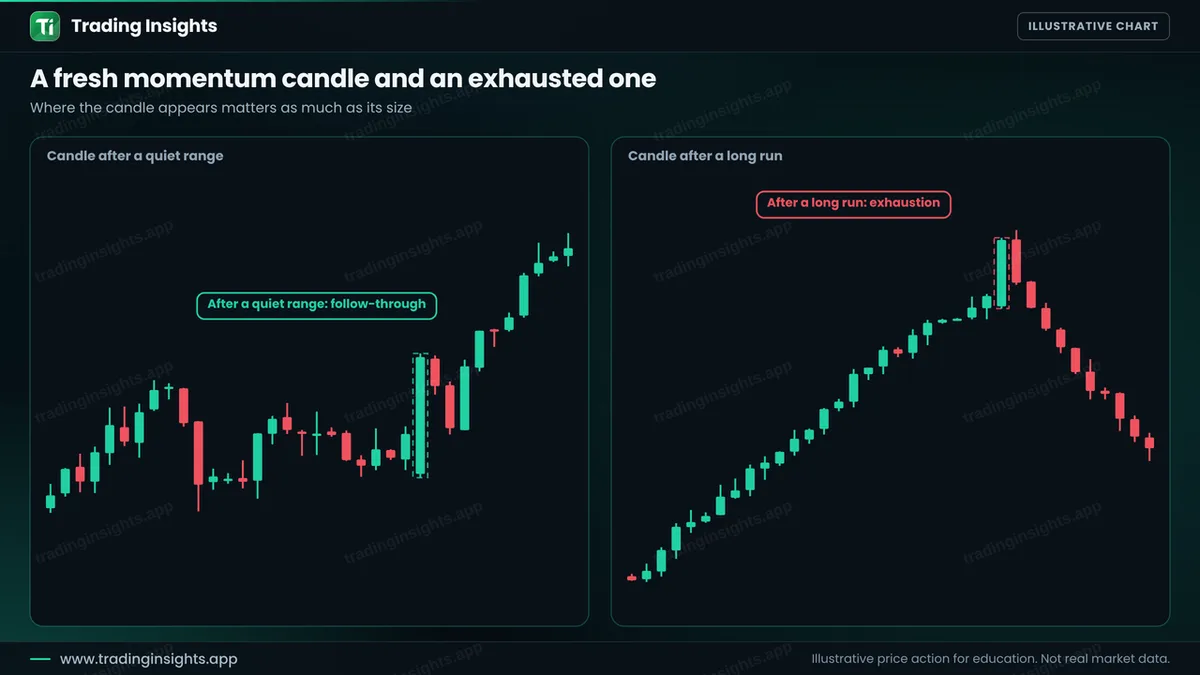
The location is critical. A momentum candle after a quiet, compressed range shows new energy. A momentum candle after a long run can show exhaustion, as the last buyers rush in near the top. Look at what happened before the candle. A strong candle at the end of a very long move is a warning, not an invitation. Compare with trend identification and pullback vs reversal.
The rules, step by step
- Find a quiet range. Several small candles in a tight area.
- Spot the momentum candle. A large body, small wicks and a close near the high, breaking above the range.
- Do not chase. Wait for a pullback toward the midpoint of the candle.
- Place a limit order. Buy at the midpoint, or enter on a bullish candle at that level.
- Place the stop. Below the low of the momentum candle with a small buffer.
- Set the target. Twice the risk, or the next resistance level.
- Cancel if it runs. If price does not pull back and keeps going, skip the trade.
A worked trade
This is an illustrative buy on EUR/USD, H1. After a quiet range, a large bullish candle forms from 1.0859 to 1.0891. Its midpoint is near 1.0875. You place a buy limit at 1.0875, the stop below the candle low at 1.0856, and the target at twice the risk, which is 1.0913. Price pulls back to the midpoint, fills the order, and then moves up.
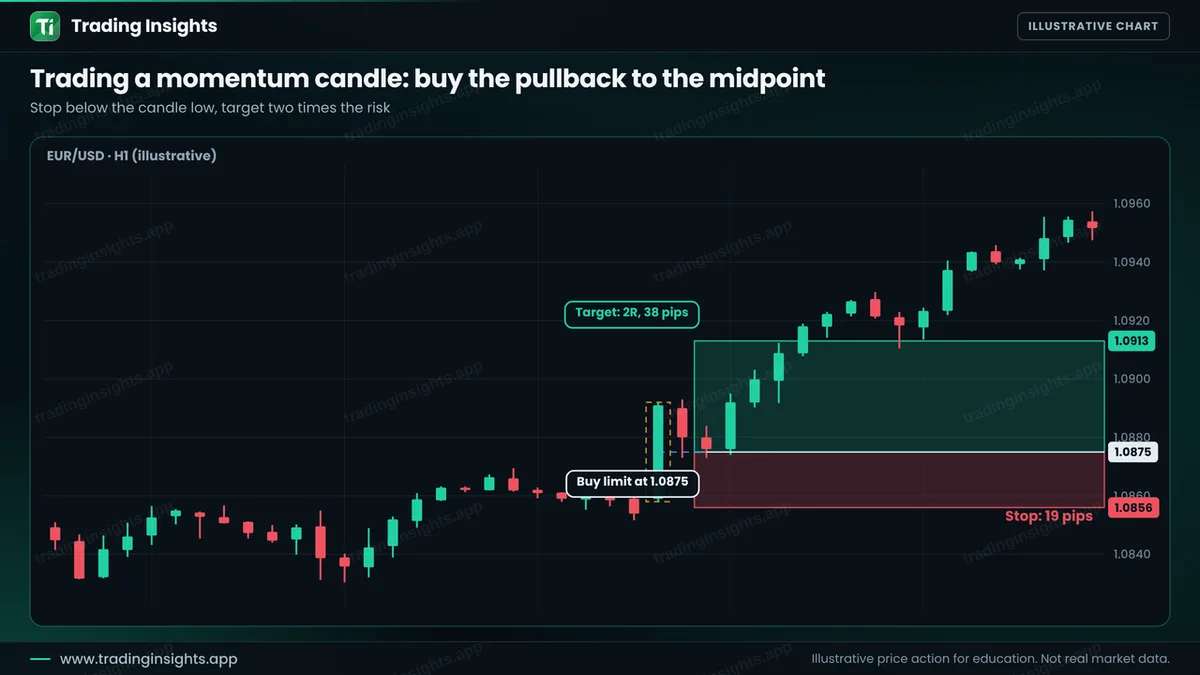
- Entry: 1.0875, a limit order at the midpoint of the candle.
- Stop loss: 1.0856, below the candle low (19 pips).
- Take profit: 1.0913 (38 pips), a ratio of 1:2.
With a $10,000 account risking 1% ($100), the position size is $100 / (19 pips x $10 per pip per lot) = about 0.53 lot. A win pays about $200, and a loss costs about $100. Check your own numbers with the position size calculator. A limit order also helps with fills. See slippage.
How to avoid the common failures
- Do not trade every big candle. A big candle in the middle of a choppy move is just noise.
- Avoid news candles. A candle caused by a news spike often reverses. See trading forex news.
- Check the next level. If resistance is right above the candle, the reward is small.
- Accept missed trades. If price never pulls back, do not chase. See FOMO in trading.
- Test it. Test on 50 or more candles. See how to backtest.
Common mistakes
- Buying the top of the momentum candle.
- Ignoring what happened before the candle.
- Placing the stop inside the candle where noise reaches it.
- Keeping a limit order open for many hours after the setup is gone.
- Trading a candle that comes from a news spike.
Frequently asked questions
What is a momentum candle?
It is a candle with a large body and small wicks, which shows that one side controlled the whole period.
Should I buy at the close of the momentum candle?
Many traders prefer to wait for a pullback toward its midpoint, which gives a better price and a smaller stop.
What if price never pulls back?
Then skip the trade. Chasing a runaway candle makes the stop wide and the reward small.
Are all strong candles good signals?
No. A strong candle after a long run can show exhaustion. Look at the location and the context.
Trading involves risk. This is education, not financial advice. The charts are illustrative and not real market data. Trading carries risk, and no method guarantees results.


