
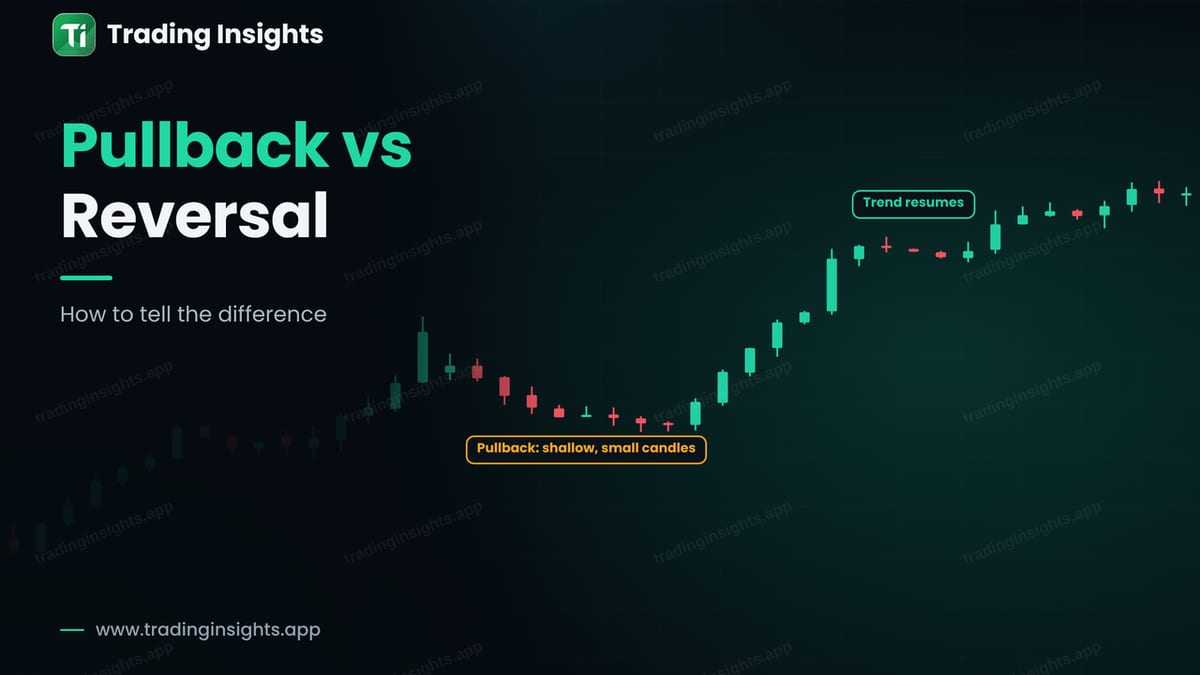
Every trend moves in waves. Price rises, falls back a little, and rises again. The fall back is a pullback, and traders love it, because it offers a better price to join the trend. But sometimes the fall back does not stop. It becomes a reversal. The hard question is how to tell the two apart while it is happening.
What a pullback looks like
A pullback is a pause inside a trend. It is usually shallow, made of small candles with overlap, and it stops above the last higher low in an uptrend. After it, price makes a new high and the trend resumes.
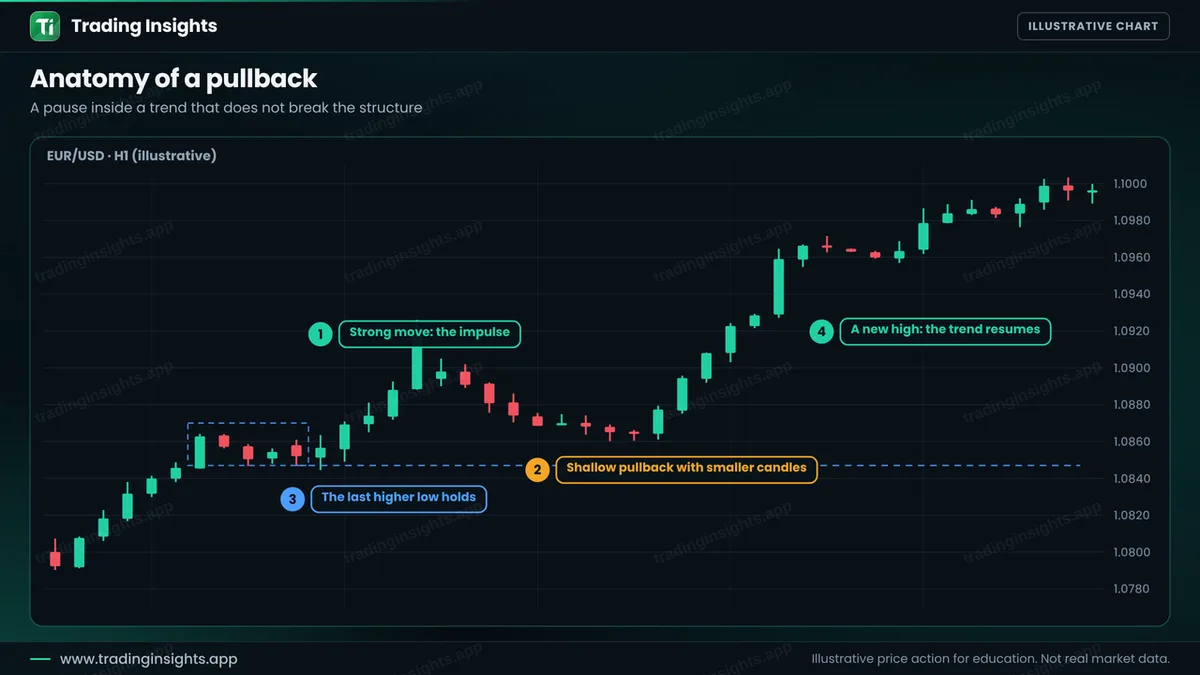
The pullback gives you a place to buy with a small stop, just under the higher low. See the EMA pullback strategy and the Fibonacci pullback strategy.
The line in the sand: the last higher low
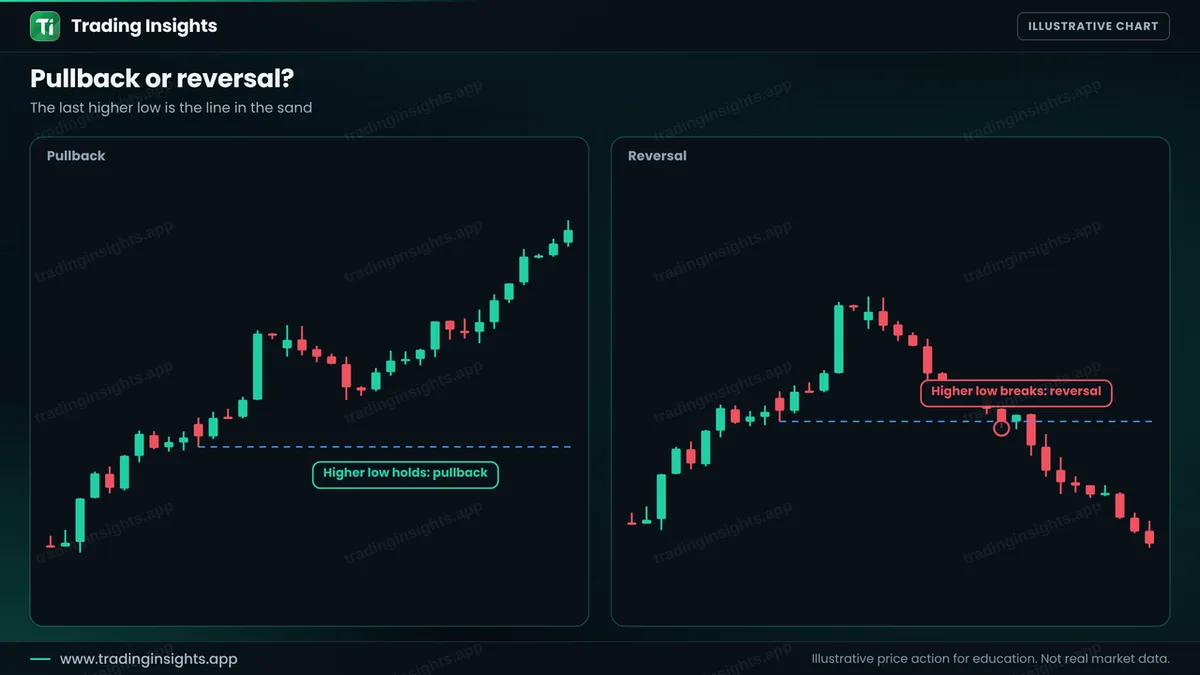
In an uptrend, the last higher low is the most important level. As long as price stays above it, the uptrend is intact and the move is a pullback. When price closes below it, the structure has broken. That is the first sign of a reversal. In a downtrend, the same logic works with the last lower high. For the language of structure, see break of structure and change of character.
Five clues to tell them apart
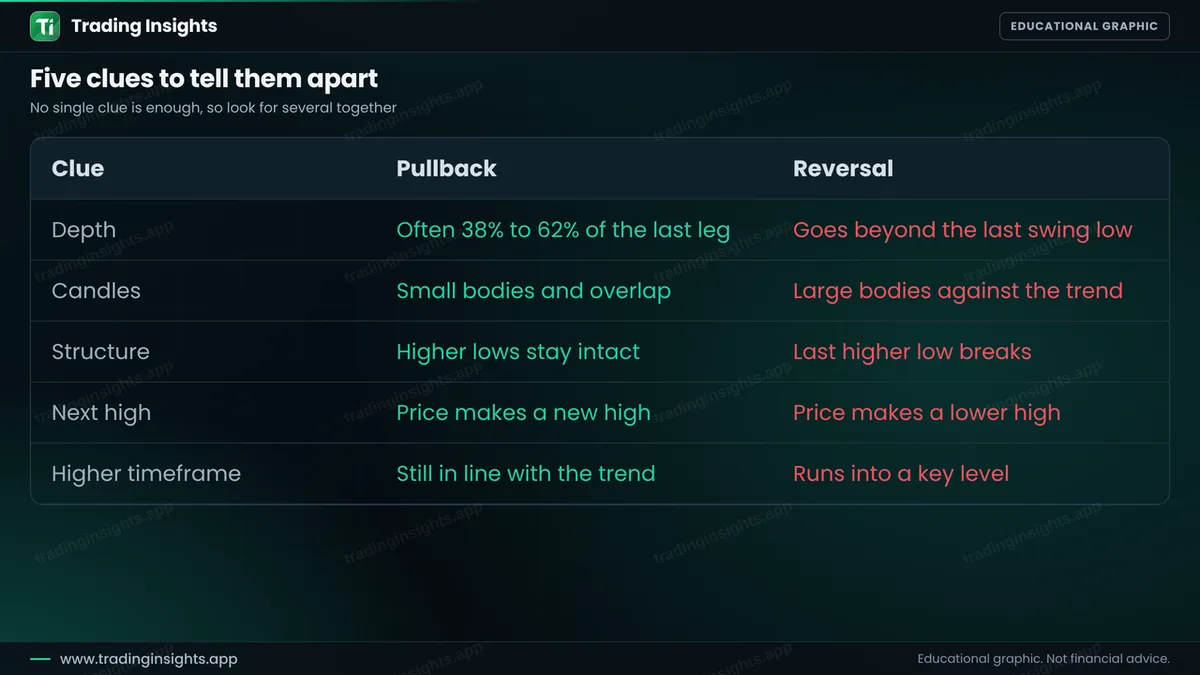
- Depth. A pullback often retraces 38% to 62% of the last leg. A move that goes beyond the last swing low is no longer a pullback.
- Candles. Small bodies and overlap suggest a pause. Large bodies against the trend suggest real selling.
- Structure. Higher lows that stay intact favour a pullback. A broken higher low favours a reversal.
- The next high. A new high means that the trend resumed. A lower high is a warning.
- The higher timeframe. If the pullback is in line with the daily trend, it is more likely to be a pause. If it runs into a key level, it may turn.
How to trade with this knowledge
- Mark the last higher low. This is your reference line.
- Wait for the pause. A pullback into a level, with small candles.
- Enter on a sign of strength. For example, a bullish candle that closes above the pause. See how to identify a trend.
- Put the stop below the higher low. If the structure breaks, the idea is wrong and you exit with a small loss.
- Do not average down. Adding to a falling trade makes a reversal costly.
The stop below the higher low also answers the question for you. If price breaks that level and you are stopped out, the move was not a pullback. You do not need to guess in advance, you only need a plan for both outcomes. Size your trade using the position size calculator.
Common mistakes
- Calling every dip a pullback and buying without a stop.
- Calling every dip a reversal and selling at the first red candle.
- Ignoring the higher timeframe.
- Marking a swing low that is not clear.
- Moving the stop lower when the higher low breaks.
Frequently asked questions
What is a pullback in trading?
It is a temporary move against the trend. In an uptrend, price falls back a little and then continues up.
How is a reversal different?
A reversal is a lasting change of direction. In an uptrend, price breaks the last higher low and starts making lower highs and lower lows.
How deep can a pullback go?
Many pullbacks retrace about 38% to 62% of the last move. A deeper move is a warning, but there is no fixed limit.
Can I know in advance?
No. You use clues, and a stop loss protects you if you are wrong.
Trading involves risk. This is education, not financial advice. The charts are illustrative and not real market data. Trading carries risk, and no method guarantees results.


