
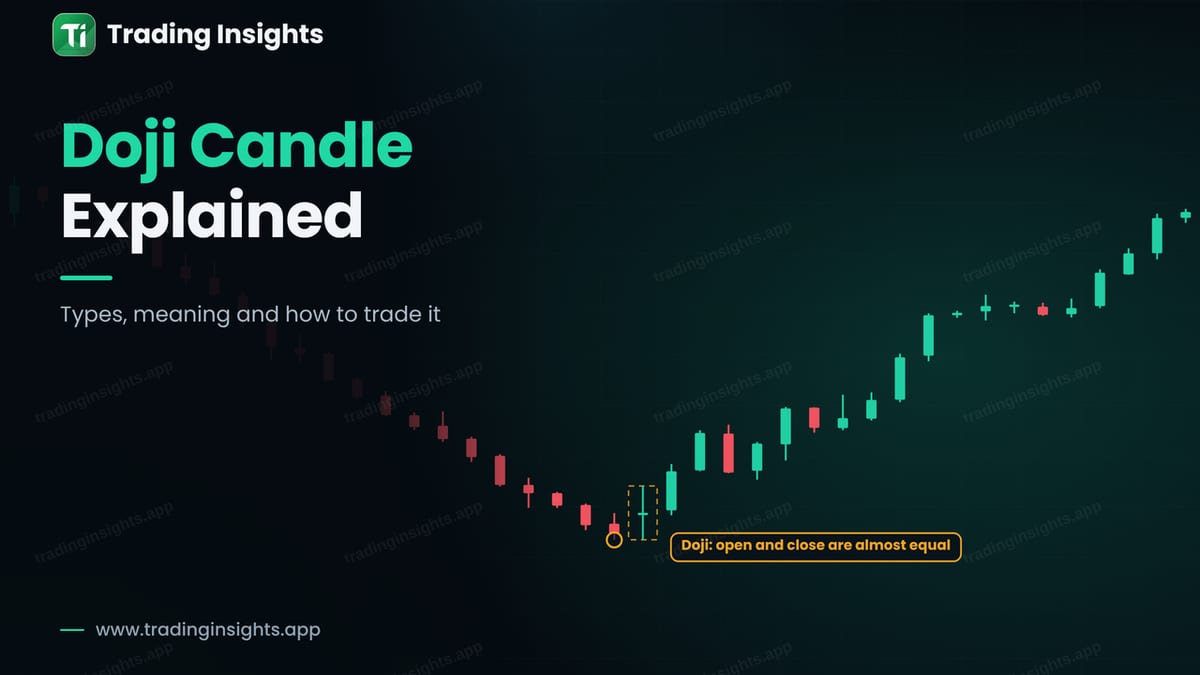
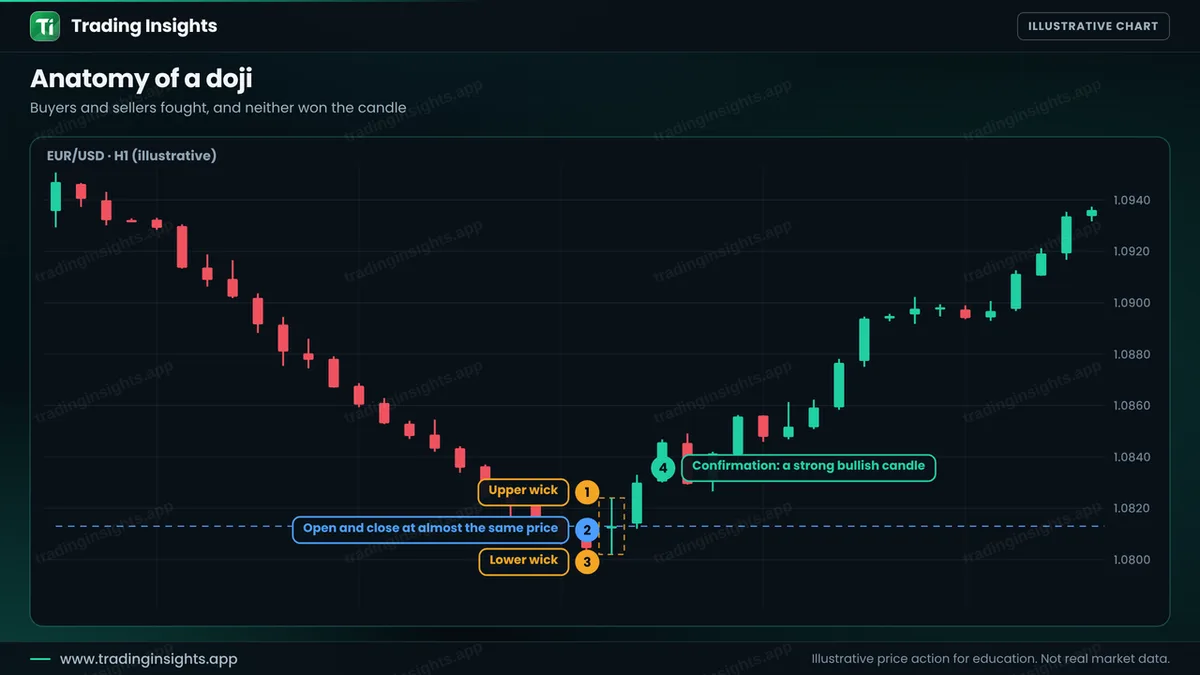
A doji is a candle where the open and the close are almost the same, so the body is very small or missing. It looks like a cross or a plus sign. It shows that buyers and sellers pushed price around during the period, but neither side won. A doji is a sign of indecision, not a signal by itself.
What a doji looks like
A doji has a tiny body and wicks on one or both sides. The wicks show how far price travelled before it returned to the open. When a doji appears after a long move, it can warn that the move is slowing down. But a doji needs context: it matters at a key level, and it matters little in the middle of nowhere.
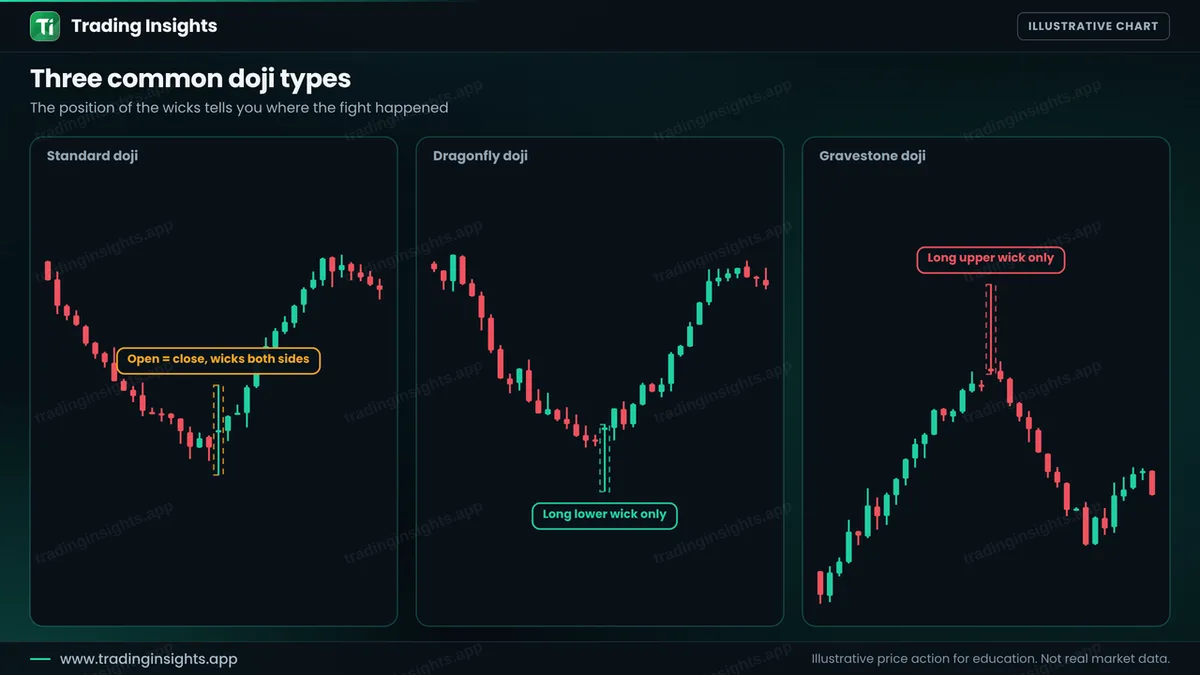
Three common types of doji
- Standard doji. Wicks of similar length on both sides. Pure indecision. A long-legged doji is the same shape with very long wicks, and it shows a wide fight.
- Dragonfly doji. A long lower wick and no upper wick. Sellers pushed price down, but buyers brought it all the way back. It is more bullish, especially at support.
- Gravestone doji. A long upper wick and no lower wick. Buyers pushed price up, but sellers brought it back. It is more bearish, especially at resistance.
The dragonfly and gravestone are close cousins of the hammer and the shooting star. For those, see pin bar strategy.
The rules, step by step
- Look for context. A doji after a clear move, at a support or resistance zone. See support and resistance.
- Do not trade the doji itself. It shows indecision, so wait for the next candle.
- Wait for confirmation. After a doji at support, a strong bullish candle that closes above the doji high is a confirmation.
- Place the stop. Below the low of the doji with a small buffer. Above the high for a sell.
- Set the target. At least two times the risk, or the next level.
A worked trade
This is an illustrative buy on EUR/USD, H1. Price falls for many candles, and a doji forms near 1.0813 with a low at 1.0802. The next candle is a strong bullish candle and closes at 1.0830. You buy there, place the stop below the doji low at 1.0800, and target twice the risk, which is 1.0890.
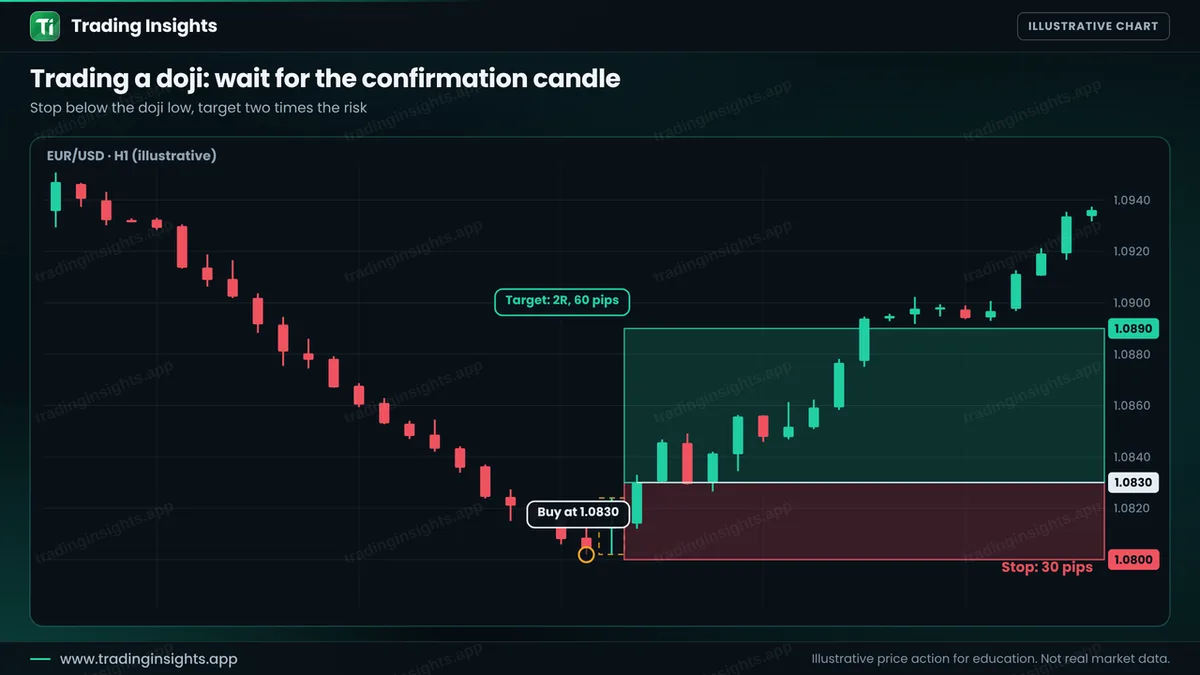
- Entry: 1.0830, after the confirmation candle closes.
- Stop loss: 1.0800, below the doji low (30 pips).
- Take profit: 1.0890 (60 pips), a ratio of 1:2.
With a $10,000 account risking 1% ($100), the position size is $100 / (30 pips x $10 per pip per lot) = about 0.33 lot. A win pays about $200, and a loss costs about $100. Check your own numbers with the position size calculator.
How to avoid the common failures
- Do not treat a doji as a reversal. It can also be a pause before the trend continues.
- Ignore dojis in a tight range. Small candles are normal there.
- Check the timeframe. A doji on a daily chart carries more weight than one on a one-minute chart.
- Learn the other patterns. See candlestick patterns for beginners and the engulfing candle.
Common mistakes
- Buying or selling the doji with no confirmation.
- Calling any small candle a doji.
- Ignoring the level and the trend.
- Placing the stop inside the wicks of the doji.
- Expecting every doji to reverse the market.
Frequently asked questions
What does a doji mean in trading?
It means that the open and the close are almost equal, so buyers and sellers are in balance. It signals indecision, not a direction.
Is a doji bullish or bearish?
On its own it is neutral. A dragonfly at support leans bullish, and a gravestone at resistance leans bearish. The next candle confirms.
What is the difference between a doji and a spinning top?
A spinning top has a small body that you can see, and a doji has an almost flat body. Both show indecision.
Can I trade a doji alone?
It is better not to. Use a level, the trend and a confirmation candle, and place a stop loss.
Trading involves risk. This is education, not financial advice. The charts are illustrative and not real market data. Trading carries risk, and no method guarantees results.


