
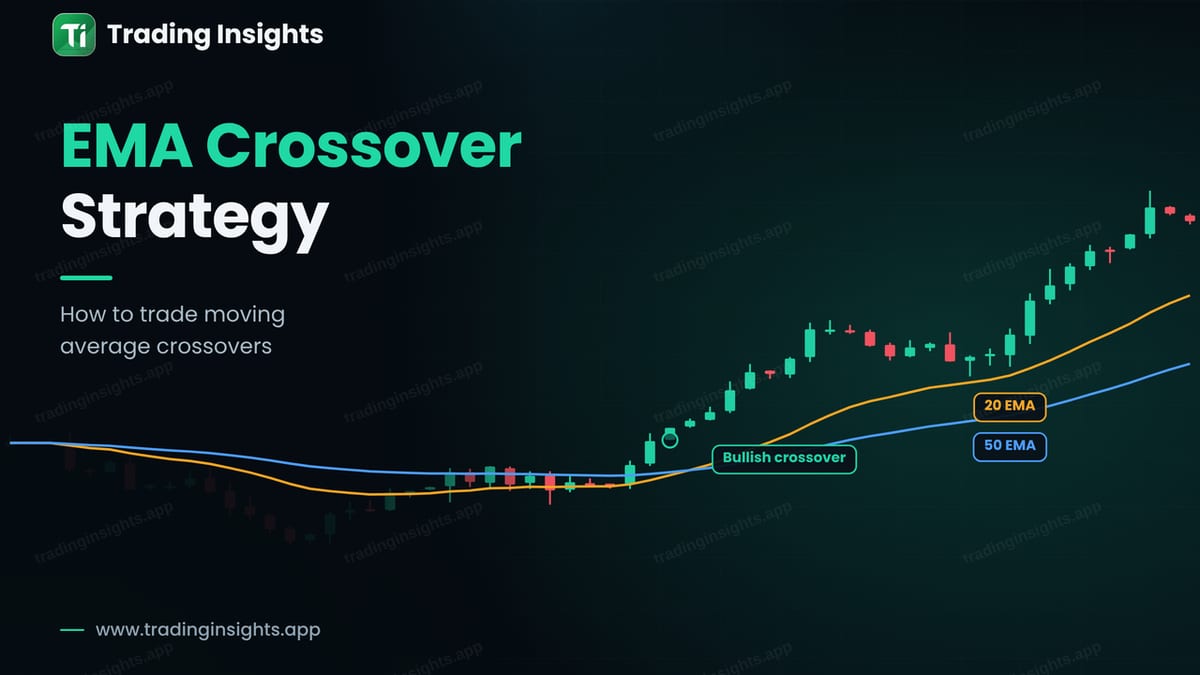
The moving average crossover is one of the oldest and simplest trading strategies. You plot two moving averages on the chart, a fast one and a slow one. When the fast average crosses above the slow one, momentum has turned up, and that is a buy signal. When it crosses below, momentum has turned down, and that is a sell signal. This article uses the 20 and 50 exponential moving averages (EMA) on the H1 chart.
What an EMA crossover looks like
The 20 EMA reacts quickly, because it follows the last 20 candles. The 50 EMA reacts slowly. When price has been falling or moving sideways, the fast line is below the slow one. When price starts to rise, the fast line turns up first, and at some point it crosses the slow line. Price is then above both lines, which suggests that buyers have taken control. For more on these averages, see moving averages: SMA vs EMA.
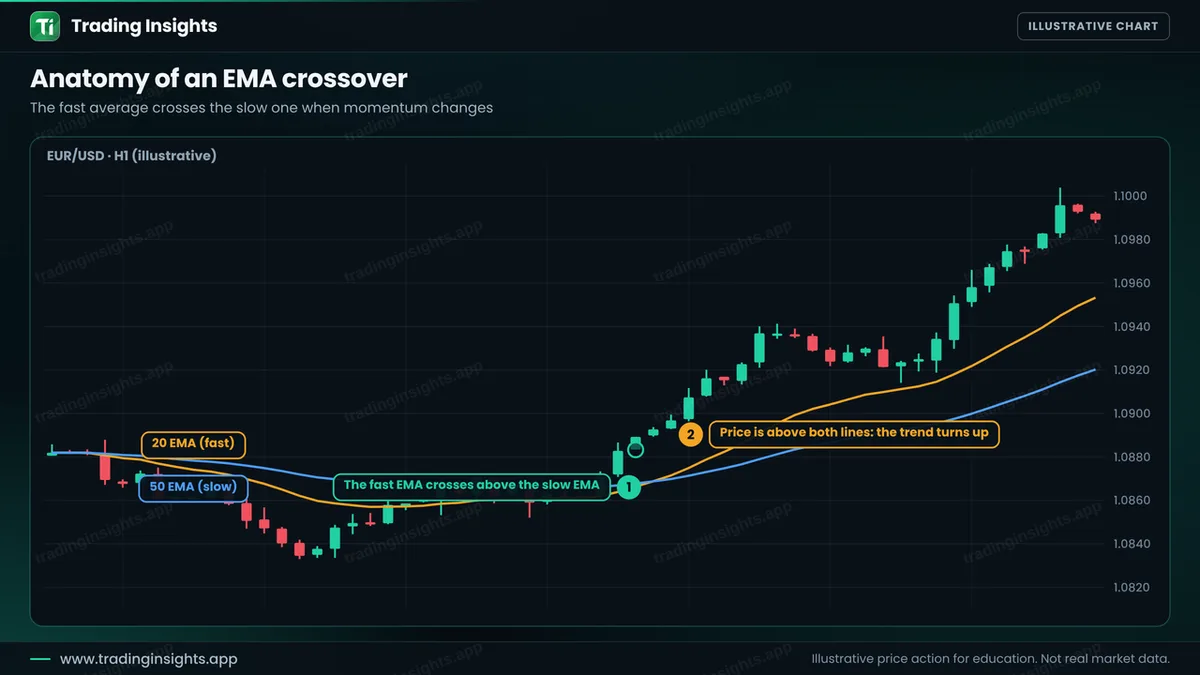
Notice that the crossover comes after the move has begun. Moving averages are lagging tools. They do not predict, they confirm. This is both their strength and their weakness: you avoid many false starts, but you enter later than a pure price signal would.
Trends and ranges
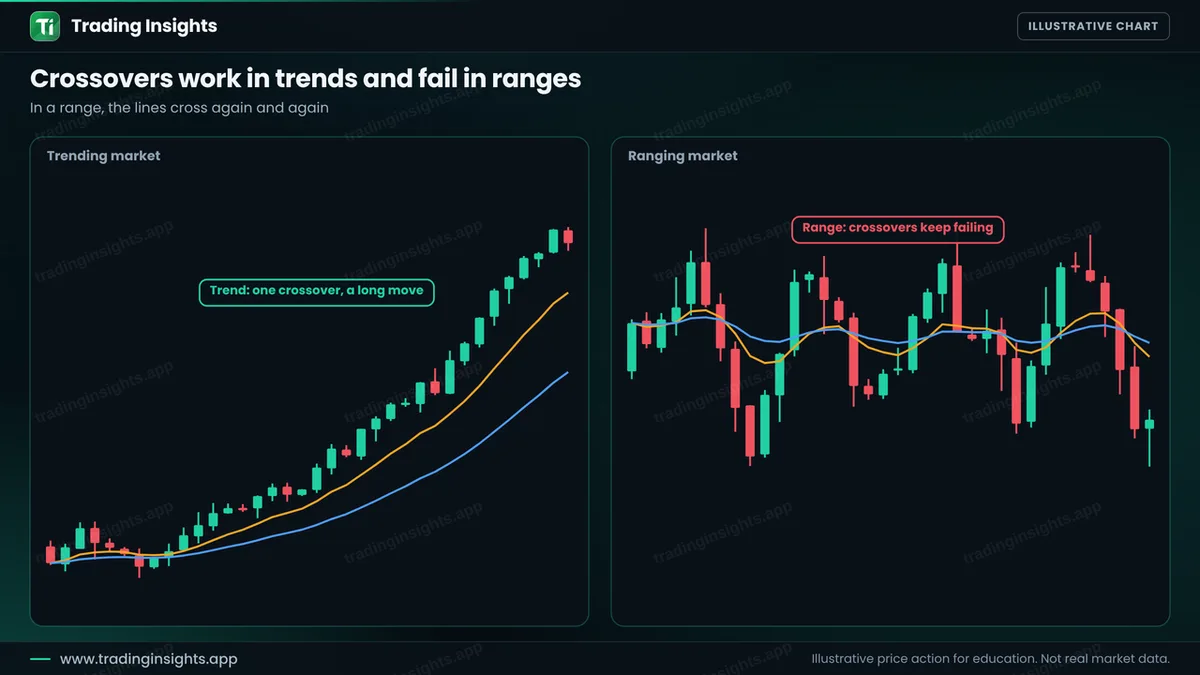
The strategy shines in a trend and suffers in a range. In a range, price moves up and down inside a band, so the averages tangle and cross again and again. Each cross is a false signal and a small loss. These are called whipsaws. The simplest protection is to skip a crossover when the averages are flat and close together. Look for clear slope and a gap between the lines. For ranges, see range trading.
The rules, step by step
- Set up the chart. Add the 20 EMA and the 50 EMA on the H1 or H4 chart.
- Wait for the cross. The 20 EMA must close above the 50 EMA for a buy, or below for a sell.
- Check the slope. The 50 EMA should be flattening or turning in the new direction, and price should be on the right side of both lines.
- Enter after the candle closes. Do not enter in the middle of the candle.
- Place the stop. For a buy, below the last swing low before the crossover, with a small buffer. For a sell, above the last swing high.
- Set the target. A common method is twice the risk. Others trail the stop behind the 20 EMA. See trailing stop and break-even stop.
- Exit on the opposite cross. If you do not use a fixed target, a cross in the other direction is a signal to close.
A worked trade
This is an illustrative buy on EUR/USD, H1. After a period of weakness, the 20 EMA crosses above the 50 EMA. The next candle closes at 1.0897. You buy there, place the stop below the last swing low before the cross at 1.0849, and target twice the risk, which is 1.0993.
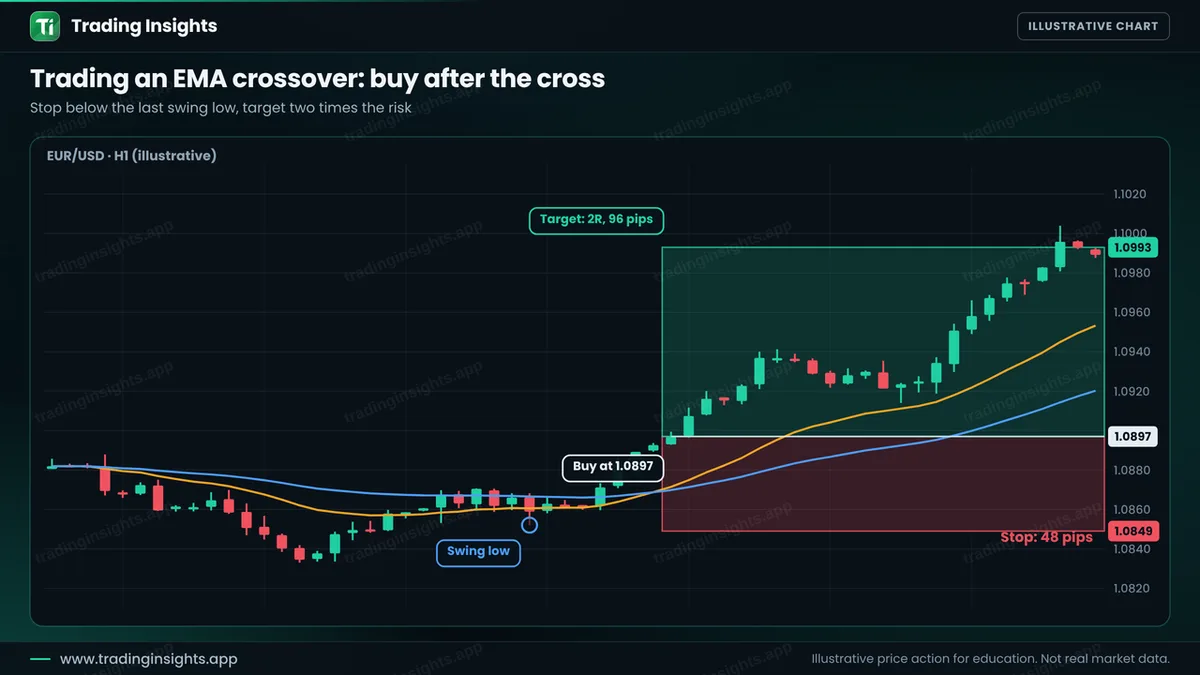
- Entry: 1.0897, after the crossover candle.
- Stop loss: 1.0849, below the last swing low (48 pips).
- Take profit: 1.0993 (96 pips), a ratio of 1:2.
With a $10,000 account risking 1% ($100), the position size is $100 / (48 pips x $10 per pip per lot) = about 0.21 lot. A win pays about $200, and a loss costs about $100. Check your own numbers with the position size calculator. The stop is wide, because the cross comes late, so the position is small.
How to avoid the common failures
- Skip flat averages. If the lines are tangled, there is no trend to follow.
- Use a higher timeframe filter. Trade crosses in the direction of the H4 or daily trend. See how to identify a trend.
- Do not expect a high win rate. Crossover systems often win less than half of their trades but earn more on the winners. See trading expectancy.
- Test it. Test on at least 50 to 100 crossovers. See how to backtest a forex trading strategy.
Common mistakes
- Trading every crossover, including those in a range.
- Entering before the candle closes.
- Using a tiny stop that is inside the normal noise.
- Changing the averages after each loss to fit the past.
- Ignoring spread and costs on a short timeframe.
Frequently asked questions
What is an EMA crossover?
It is a signal that appears when a fast exponential moving average crosses a slow one. A cross up suggests a buy, and a cross down suggests a sell.
Which EMA settings are best?
There is no single best setting. 20 and 50 are common for H1 and H4. Test the settings on your own pair and timeframe, and avoid over-fitting.
Why do crossovers fail?
Moving averages lag, so they give many false signals in ranging markets, and they enter late in strong moves.
Is the EMA crossover good for beginners?
It is simple and rule-based, which helps. But beginners should test it, use a stop and avoid ranging markets.
Trading involves risk. This is education, not financial advice. The charts are illustrative and not real market data. Trading carries risk, and no method guarantees results.


