
Many beginners judge a strategy by its win rate. A strategy that wins seven trades out of ten sounds great. But the win rate alone says nothing about money, because it ignores how much you win and how much you lose. The number that joins these pieces is the expectancy.
What expectancy means
Expectancy is the average amount you can expect to make or lose per trade over many trades. It is measured in R, where 1R is the amount you risk on one trade. If you risk $100, then 1R is $100. A positive expectancy means that the strategy has an edge, and a negative one means that it loses over time.
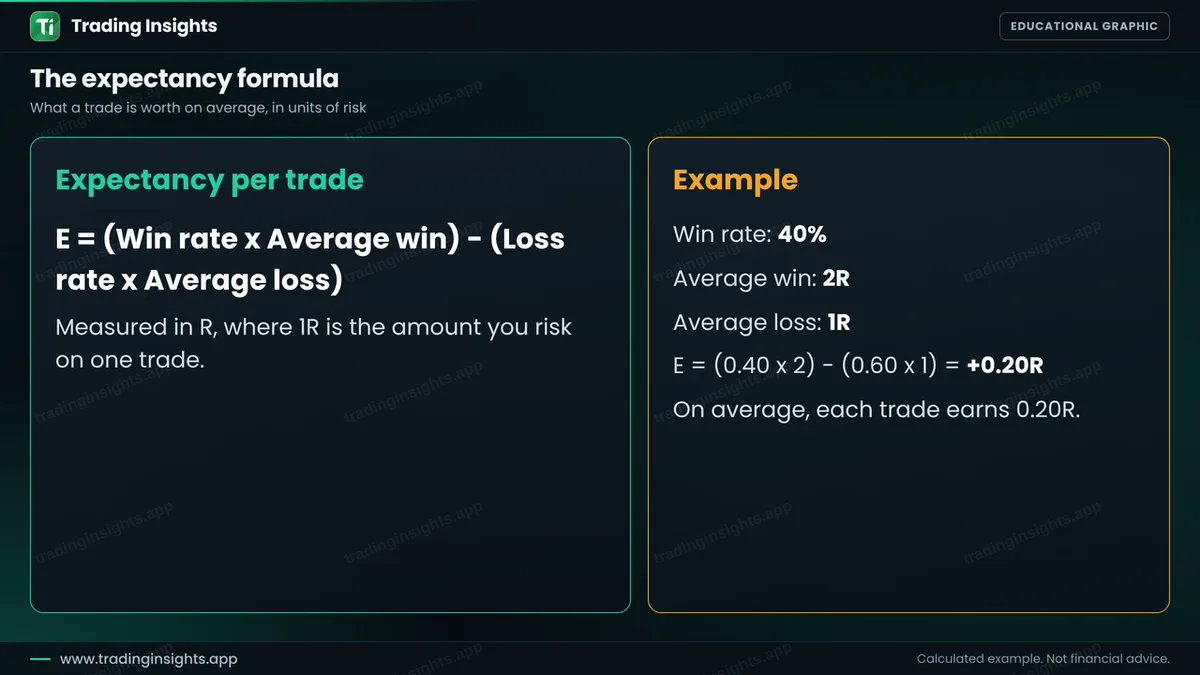
In the example, a trader wins 40% of the time. The average win is 2R and the average loss is 1R. So the expectancy is (0.40 x 2) - (0.60 x 1) = +0.20R. On average, each trade earns 0.20R, which is $20 when 1R is $100. Over 100 trades, that is about $2,000, before costs.
The win rate you need at each ratio
The risk-reward ratio decides how often you must win to break even. The formula is: break-even win rate = 1 / (1 + reward-to-risk ratio). If you win 2R and lose 1R, you only need to win one trade in three.
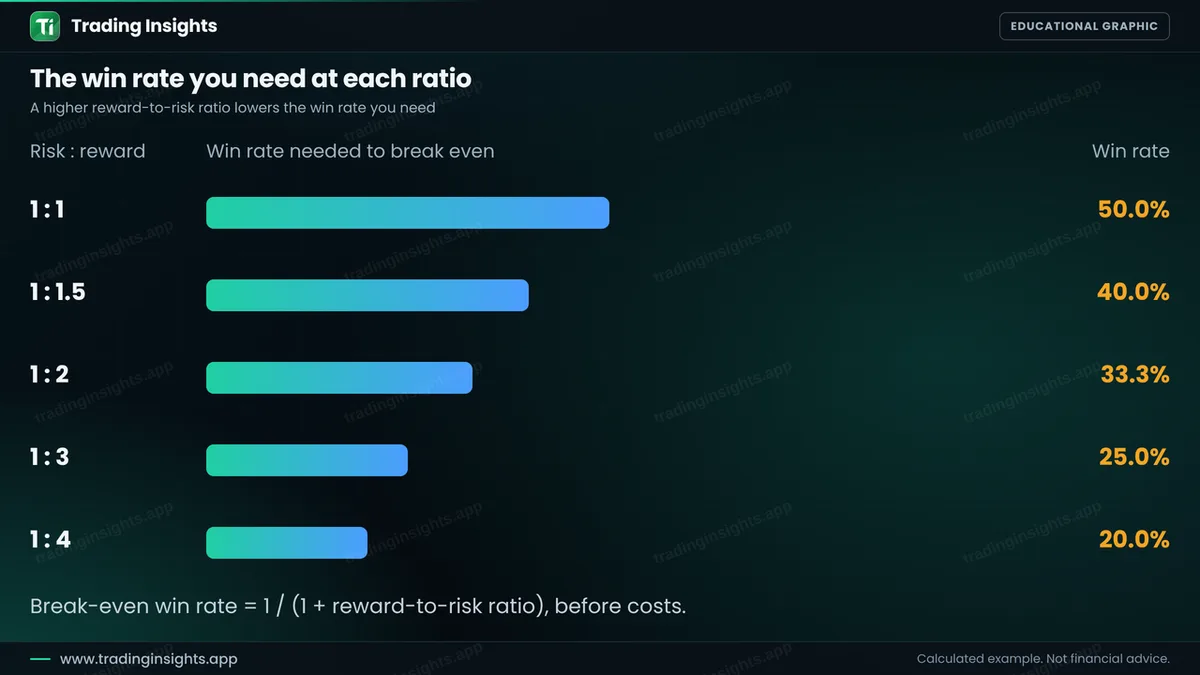
This is why many traders aim for a ratio of at least 1:1.5 or 1:2. But a bigger target is not free: the further the target, the less often it is reached. The right balance is found by testing. For more, see how to calculate risk to reward ratio and the risk reward calculator.
A high win rate can still lose
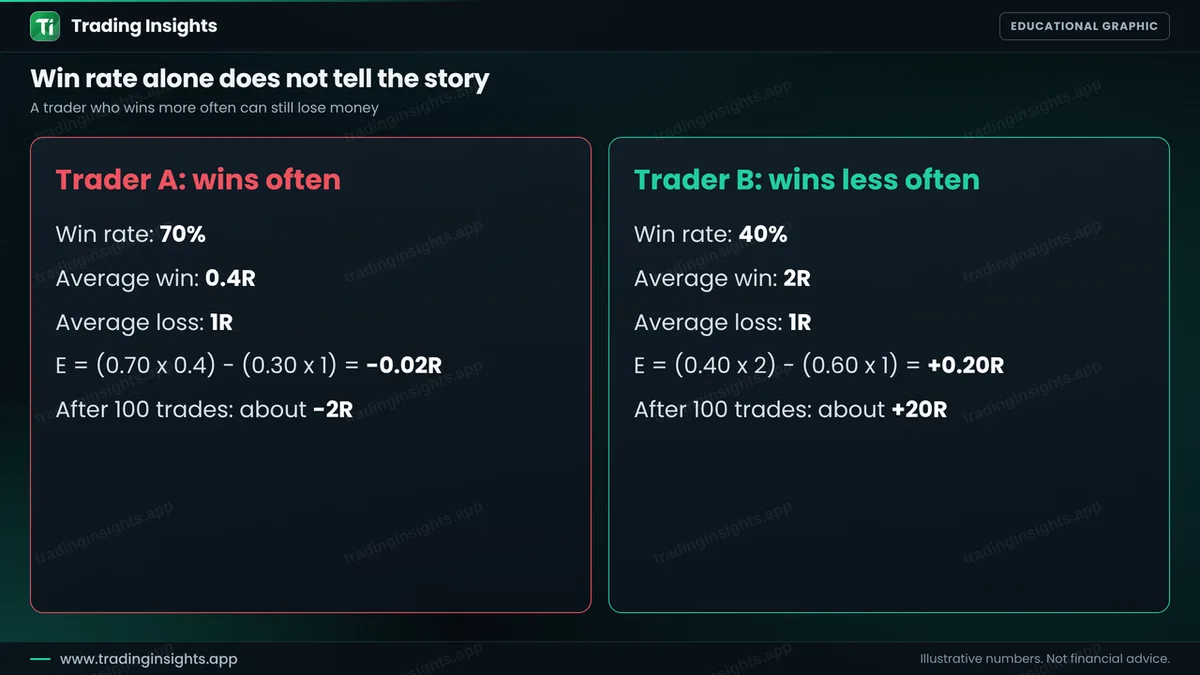
Trader A wins 70% of trades, but the average win is only 0.4R while the average loss is 1R. The expectancy is (0.70 x 0.4) - (0.30 x 1) = -0.02R. After 100 trades, that is about -2R. Trader B wins only 40% but earns 2R on average per win. The expectancy is +0.20R, or about +20R after 100 trades. The numbers are illustrative, but the lesson is real: you cannot judge a strategy by one number.
How to calculate your own expectancy
- Record every trade in R. Use a trading journal. A win of $250 with $100 risk is +2.5R.
- Count the wins and losses. Get the win rate and the loss rate.
- Find the averages. Add up the winning R and divide by the number of wins. Do the same for losses.
- Apply the formula. Include costs such as spread and commission. See forex trading costs.
- Use enough trades. Fifty to one hundred trades give a better picture than ten. See how to backtest.
What expectancy cannot tell you
- The order of trades. A positive expectancy can still have a long losing streak. See losing streaks.
- The future. Markets change, so a past edge can fade.
- Small samples. A few trades prove nothing.
Common mistakes
- Judging a strategy by win rate only.
- Forgetting spread and commission in the average loss.
- Changing the rules after every few trades.
- Using too few trades to calculate the numbers.
- Mixing different strategies in one set of results.
Frequently asked questions
What is expectancy in trading?
It is the average result per trade, calculated from the win rate, the average win and the average loss. It is usually measured in R.
What is a good expectancy?
Any positive number after costs means an edge. A value such as +0.2R or higher is often seen as useful, but a small sample can mislead.
Is a 50% win rate enough?
Only if your average win is larger than your average loss. At 1:1 and 50%, you break even before costs.
Does expectancy include costs?
It should. Spread and commission reduce the average win and increase the average loss, so include them in the calculation.
Trading involves risk. This is education, not financial advice. The charts are illustrative and not real market data. Trading carries risk, and no method guarantees results.


