
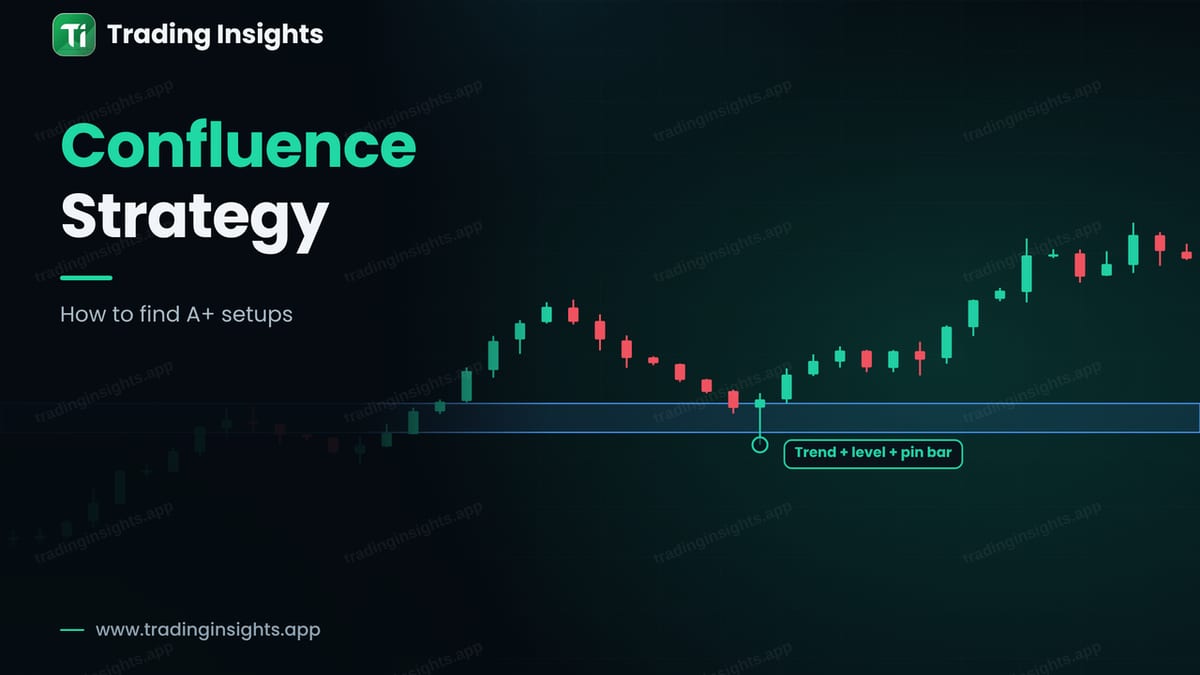
Confluence means that several independent reasons point to the same trade at the same place. A buy at a support level is one reason. A buy at a support level in an uptrend is two. A buy at a support level in an uptrend with a bullish pin bar is three. The more reasons agree, the better the setup. Traders call the best ones A+ setups, and a confluence strategy simply means that you trade only those.
Why confluence helps
Every tool has weaknesses. A level can fail, a candle pattern can fail, and a trend can end. But the chance that several different signals fail together at the same moment is lower. Confluence also reduces the number of trades, so it works against overtrading. You wait for a few good setups, not a lot of average ones.
What a confluence setup looks like
A simple, strong combination uses three layers: the trend, the level and the trigger. The trend tells you the direction. The level tells you where. The trigger tells you when.
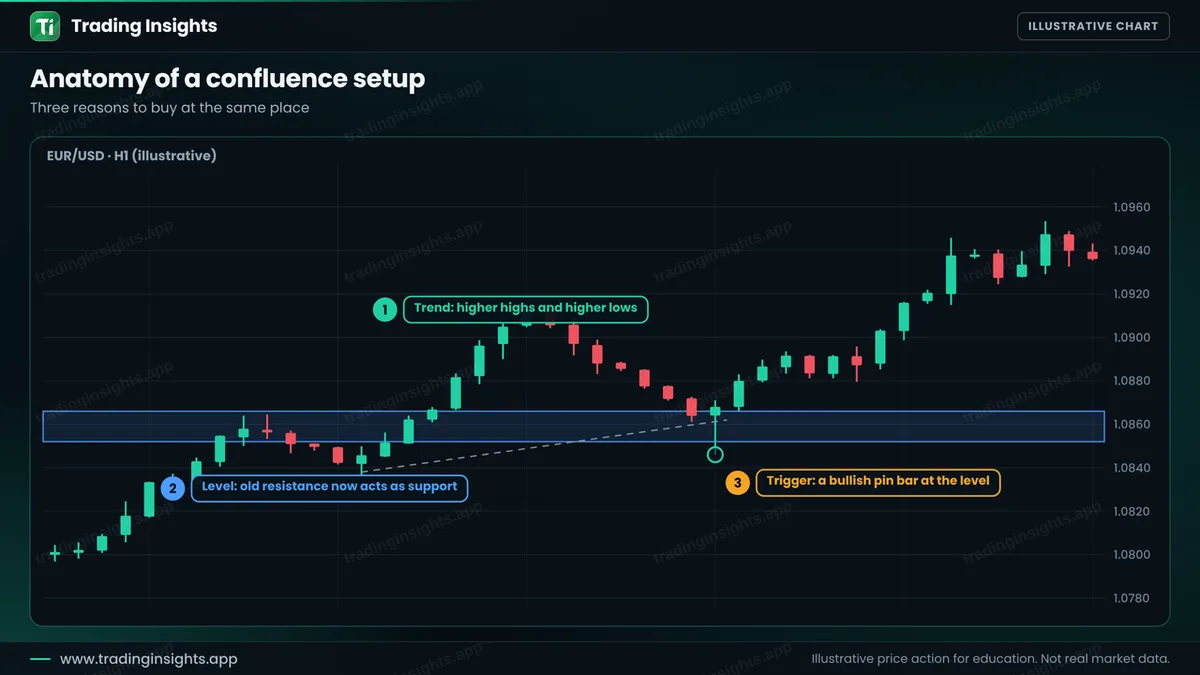
- Trend. Higher highs and higher lows. See how to identify a trend.
- Level. A support zone, or an old resistance zone that now acts as support. See support and resistance.
- Trigger. A clear candle signal at the level, such as a pin bar or an engulfing candle. See pin bar strategy.
The A+ setup checklist
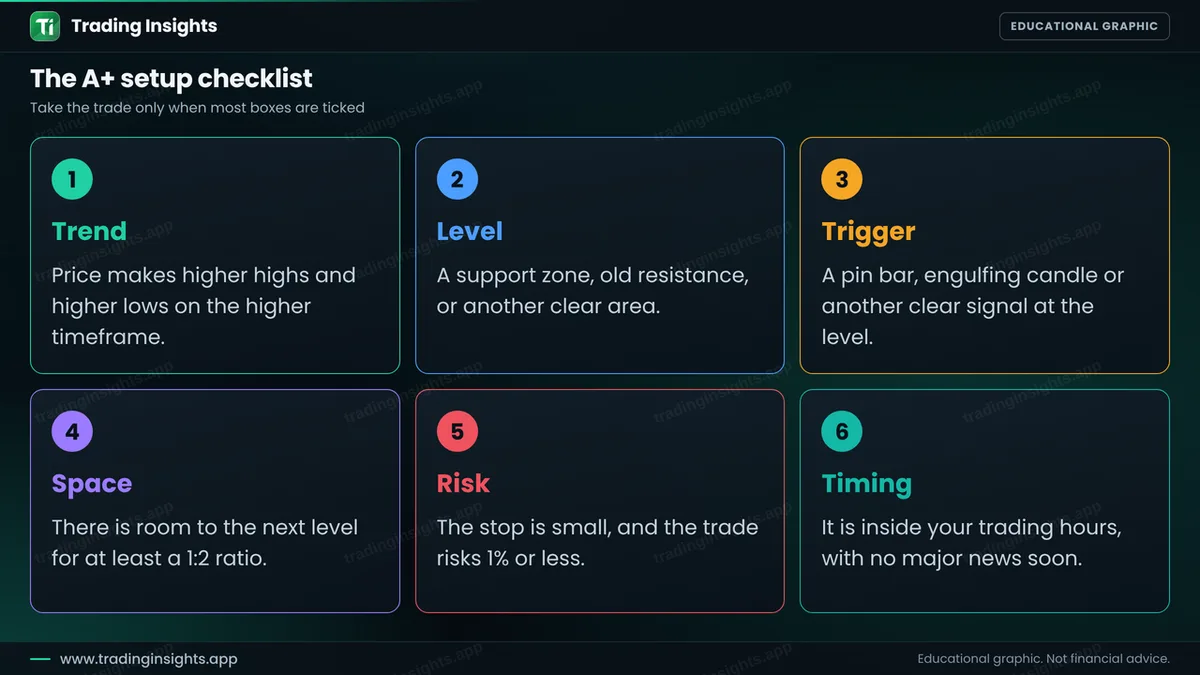
The checklist adds three more checks to the core three. Space means there is room to the next level for at least a 1:2 ratio. Risk means the stop is small and the trade risks 1% or less. Timing means it falls inside your trading hours with no major news close by. A written list turns a feeling into a rule. See how to build a trading plan and journal.
Score each setup
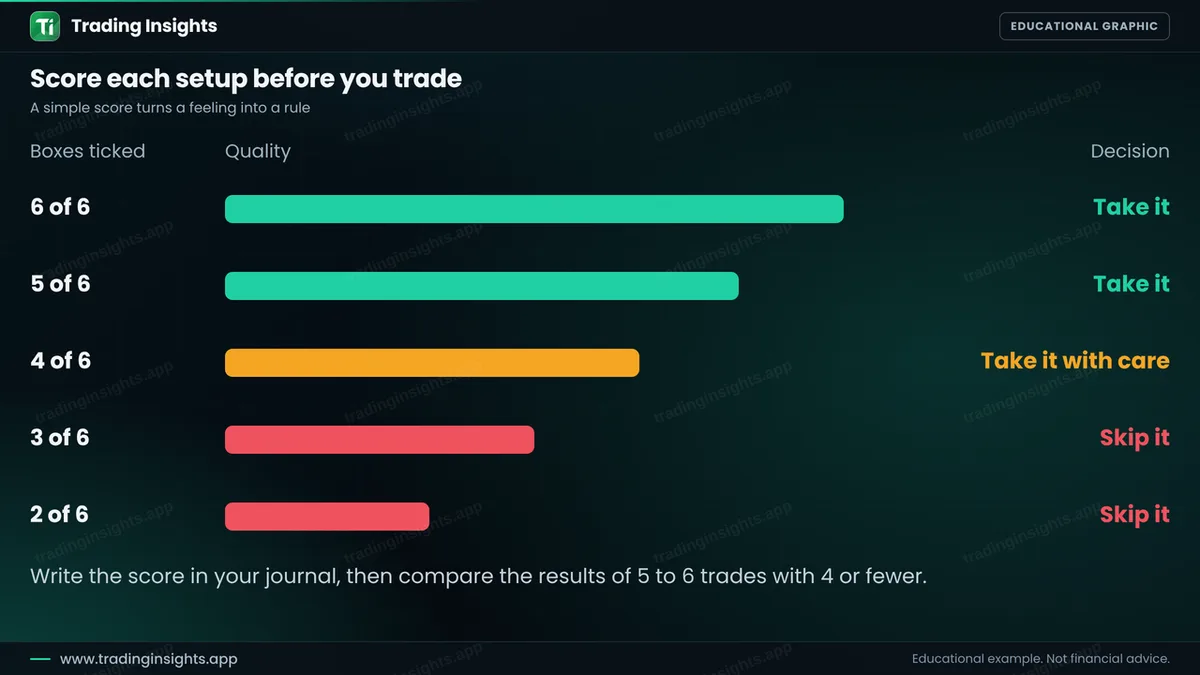
Give one point for each box. With six points, take the trade. With five, take it. With four, take it only with care, for example at a smaller size. With three or fewer, skip it. Write the score in your journal. After 30 or more trades, compare the results of 5 to 6 point trades with the others. This is an easy way to learn which of your own rules matters the most.
A worked trade
This is an illustrative buy on EUR/USD, H1. Price is in an uptrend. It pulls back to a former resistance zone near 1.0852 to 1.0866, and a bullish pin bar forms with a high at 1.0871 and a low at 1.0846. You place a buy stop at 1.0872, above the pin bar, and the stop loss at 1.0844, below it. The target is twice the risk, which is 1.0928.
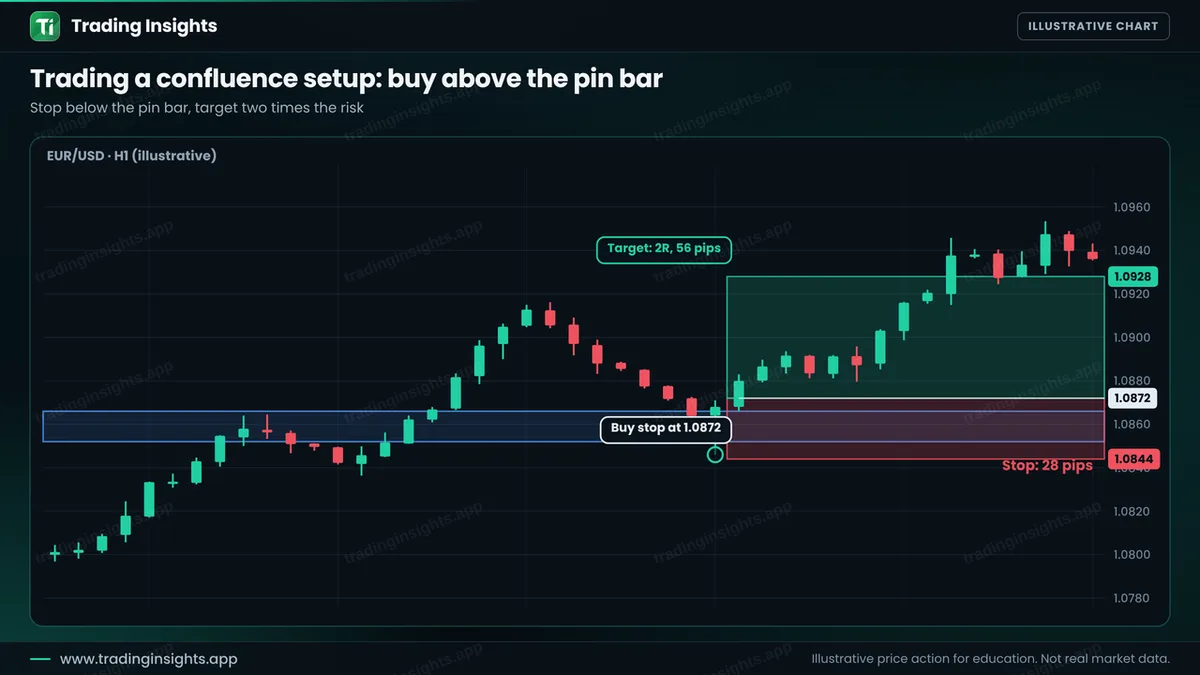
- Entry: 1.0872, a buy stop above the pin bar high.
- Stop loss: 1.0844, below the pin bar low (28 pips).
- Take profit: 1.0928 (56 pips), a ratio of 1:2.
With a $10,000 account risking 1% ($100), the position size is $100 / (28 pips x $10 per pip per lot) = about 0.36 lot. A win pays about $200, and a loss costs about $100. Check your own numbers with the position size calculator.
How to avoid the common failures
- Do not count the same reason twice. Two indicators that use the same data are one reason, not two.
- Do not hunt for confluence. If you must squeeze a reason out of the chart, it is not there.
- Keep the list short. Five or six checks are enough. A list of twenty items is never used.
- Test it. Mark 50 or more setups on past charts and compare the scores. See how to backtest.
Common mistakes
- Waiting for perfect setups and never trading.
- Ticking boxes after the fact to justify a trade.
- Adding more and more tools to the chart.
- Ignoring the stop loss because the setup looks strong.
- Increasing the size on an A+ setup. Strong setups still lose.
Frequently asked questions
What is confluence in trading?
It is the meeting of several independent signals, such as trend, level and a candle pattern, at the same place and time.
How many confluences do I need?
A common minimum is three: trend, level and trigger. A written checklist and a score help you decide.
Does confluence guarantee a win?
No. It improves the quality of the setup, but any trade can lose, so a stop loss and fixed risk are still required.
Can I use indicators for confluence?
Yes, but choose tools that give different information, such as a moving average for trend and a candle pattern for the trigger. Two similar indicators count as one.
Trading involves risk. This is education, not financial advice. The charts are illustrative and not real market data. Trading carries risk, and no method guarantees results.


